Project Euler: Math/Programming Challenge

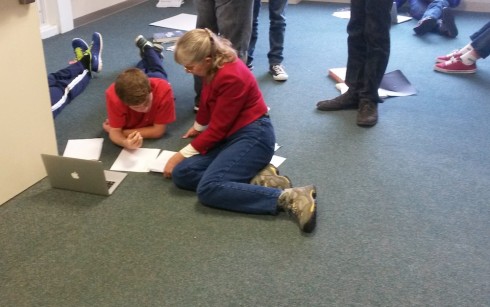
On the recommendation of Mr. Schmidt, two of my students have been quite fascinated over the last few days trying to solve problems on Project Euler. They’ve been working on them together to, I suspect, the detriment of some of their other classes, but as their math teacher I find it hard to object.

An example problem is something like this:

If we list all the natural numbers below 10 that are multiples of 3 or 5, we get 3, 5, 6 and 9. The sum of these multiples is 23.

Find the sum of all the multiples of 3 or 5 below 1000.

They’ve been solving them numerically using Python. It’s been quite fascinating to see.

Finding Volumes Using the Disk Method

Mr. Alex Shine's program to calculate the volume of a curve rotated around the x-axis using the Disk Method in Calculus.
Student’s program to calculate the volume of a curve rotated around the x-axis using the Disk Method in Calculus.

This VPython program was written by a student, Mr. Alex Shine, to demonstrate how to find the volume of a curve that’s rotated around the x-axis using the disk method in Calculus II.

The program finds volume for the curve:

 y = -\frac{x^2}{4} + 4

between x = 0 and x = 3.

To change the curve, change the function R(x), and to set the upper and lower bounds change a and b respectively.

volume_disk_method.py by Alex Shine.

from visual import*

def R(x):
    y = -(1.0/4.0)*x**2 + 4
    return y

dx = 0.5

a = 0.0

b = 3.0

x_axis = curve(pos=[(-10,0,0),(10,0,0)])

y_axis = curve(pos=[(0,-10,0),(0,10,0)])

z_axis = curve(pos=[(0,0,-10),(0,0,10)])

line = curve(x=arange(0,3,.1))
line.color=color.cyan
line.radius = .1
line.y = -(1.0/4.0) * (line.x**2) + 4

#scene.background = color.white

for i in range(-10, 11):

    curve(pos=[(-0.5,i),(0.5,i)])
    curve(pos=[(i,-0.5),(i,0.5)])

VT = 0


for x in arange(a + dx,b + dx,dx):

    V = pi * R(x)**2 * dx

    disk = cylinder(pos=(x,0,0),radius=R(x),axis=(-dx,0,0), color = color.yellow)

    VT = V + VT

    print V

print "Volume =", VT

Electricity and Magnetism Experiments

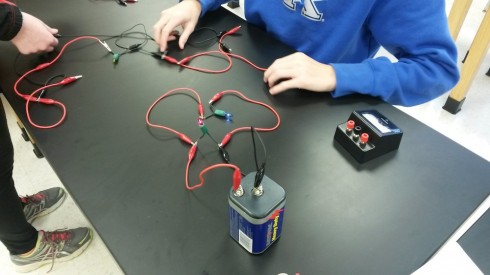
Building bulbs into parallel circuits.

Last week, my middle schoolers did a set of experiments on electricity and magnetism. They answered the questions:

  • How does the voltage across each light bulb change as you add more and more bulbs to a parallel circuit?
  • How does the voltage across each light bulb change as you add more and more bulbs to a series circuit?
  • How does the number of coils of wire wrapped around a nail affect it’s magnetism (as measured by the number of paperclips it can pick up)?
  • How does the amount of salt mixed into water affect its conductivity?
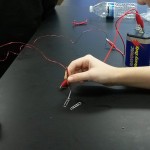
An electromagnetic nail lifts two paperclips.
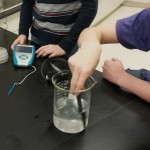
Students measure the conductivity of a salt water solution.

Each question is designed so that students have something to measure and will be able to use those measurements to make predictions. For example, once they’ve measured the voltage across four bulbs in series, they should be able to predict the voltage across the bulbs in a series of ten.

Some of the experiments, like the nail electromagnet, should have simple linear trends, with students choosing the advanced option having to find an equation to fit their data for the predictions. And I’ll challenge the students in Algebra II to find the equations for the inverse relationships–I’ve already asked their math teacher (Mr. Schmidt) to help them out if they need it.

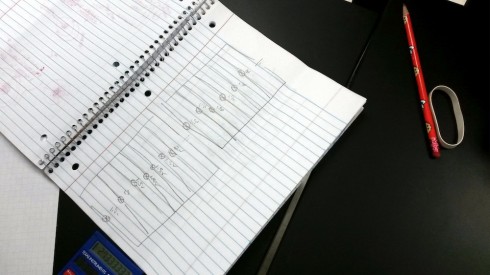
This has also provided the opportunity for them to apply what they’ve just learned about drawing circuit diagrams (we use this set of symbols).

Circuit diagrams of bulbs in parallel. The voltage difference across each bulb is also noted.

Extracting Lavender Oil

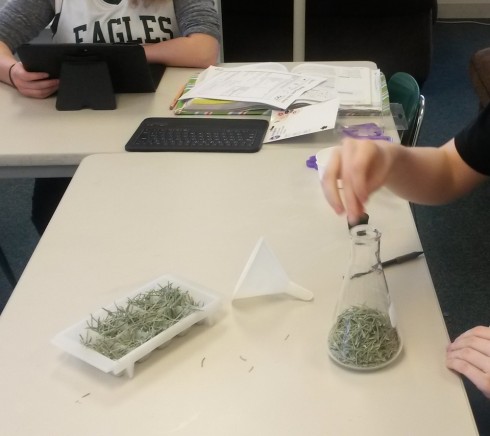
Lavender leaves are placed into a flask.

While steam distillation is the recommended method for extracting oils from herbs, we’re trying a quick an dirty method of simply heating up the lavender leaves in water (up to 40 ºC) and seeing if any of the oils float to the top. If this does not work, we’ll still have produced some lavender scented water for our soapmaking.

The lavender leaves came from the large bushes out by the preschool that the outddoor group trimmed for Ms. Dicker.

DNA Models and Games

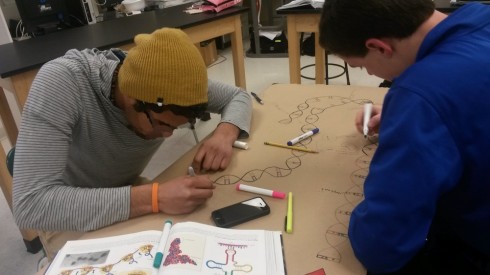
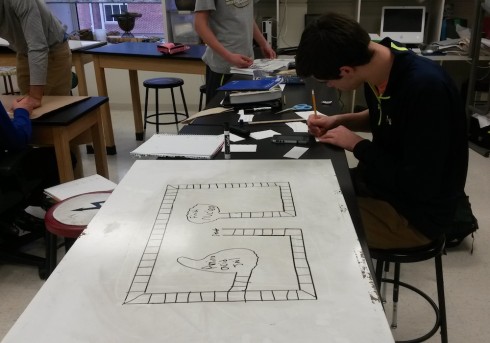
The DNA strand in this board game splits as players end up on different paths based on their choices in the game.

Ms. Mertz’s class is studying DNA–replication, translation, transcription, etc.–and she gave them the option of making a model or creating a game to test each others knowledge. There were some interesting projects:

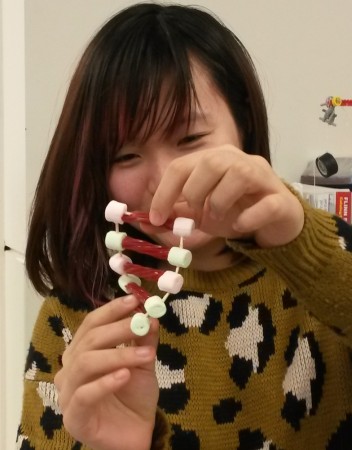
A DNA strand modeled with the bases represented by colored marshmallows. Toothpicks connect the marshmallows along the backbone of the helices, while  Twizzlers are used to show the bonding across the two DNA strands.
A DNA strand modeled with the bases represented by colored marshmallows. Toothpicks connect the marshmallows along the backbone of the helices, while Twizzlers are used to show the bonding across the two DNA strands.
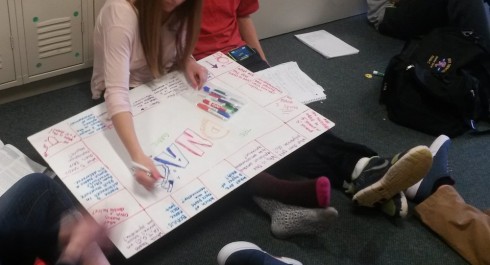
The quiz questions in this board game are visible to all the players, which allows for more in-depth discussion of the answers.
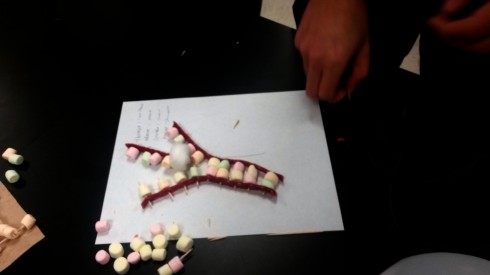
Helicase (the cotton ball) splits the DNA double helix.
Ms. Mertz helps a student with their research project on cloning.
The study of DNA and heredity offer great opportunities to study probability. In this case, a player has to traverse 80 squares by rolls of a single dice, and then answer a question from a card. If they get the wrong answer they do not advance, but if they pull a Go to Jail card they have to go back to Jail. If there are 20 cards and two of them send you back to Jail, what's the probability of anyone finishing the game?
The study of DNA and heredity offer great opportunities to study probability. In this case, a player has to traverse 80 squares by rolls of a single dice, and then answer a question from a card. If they get the wrong answer they do not advance, but if they pull a Go to Jail card they have to go back to Jail. If there are 20 cards and two of them send you back to Jail, what’s the probability of anyone finishing the game?

Blueberries in the Snow

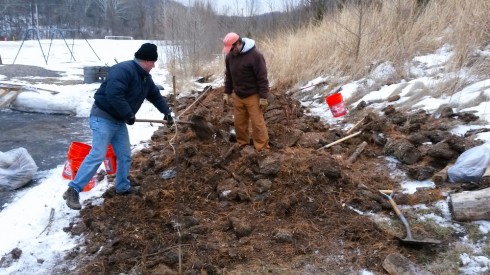
Dr. Sansone and a parent volunteer, transplant blueberry bushes into the partly frozen ground.

Last weekend was not the optimum time for transplanting berry bushes. The top five centimeters of the soil was still frozen, and the air temperature was below zero Celsius with a cold breeze on top of it. However, we needed to get fourteen blueberry bushes moved, and, with a lot of help from some parents and a couple students, we were able to get the bushes and enough soil laid out to give them a good chance of success when the soil warms up.

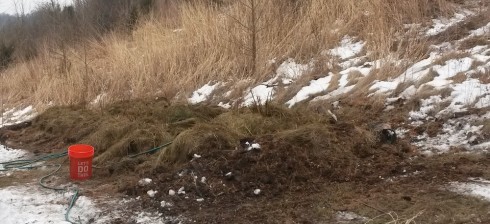
Raspberry mounds protected by straw await warmer weather.

Sine Curves

Frequency.
Frequency.

I’ve slapped together this simple VPython program to introduce sinusoidal functions to my pre-Calculus students.

  • Left and right arrow keys increase and decrease the frequency;
  • Up and down arrow keys increase and decrease the amplitude;
  • “a” and “s” keys increase and decrease the phase.
Amplitude.
Amplitude.

The specific functions shown on the graph are based on the general function:

 y =  A \sin{F x + P}

where:

  • A — amplitude
  • F — frequency
  • P — phase
Phase. Note how the curve seems to move backward when the phase increases.

When I first introduce sinusoidal functions to my pre-Calculus students I have them make tables of the functions (from -2π to 2π with an interval of π/8) and then plot the functions. Then I’ll have them draw sets of sine functions so they can observe different frequencies, amplitudes, and phases.

from visual import *

class sin_func:
    def __init__(self, x, amp=1., freq=1., phase=0.0):
        self.x = x
        self.amp = amp
        self.freq = freq
        self.phase = phase

        self.curve = curve(color=color.red, x=self.x, y=self.f(x), radius=0.05)
        self.label = label(pos=(xmin/2.0,ymin), text="Hi",box=False, height=30)
        
    def f(self, x):
        y = self.amp * sin(self.freq*x+self.phase)
        return y

    def update(self, amp, freq, phase):
        self.amp = amp
        self.freq = freq
        self.phase = phase
        self.curve.y = self.f(x)
        self.label.text = self.get_eqn()

    def get_eqn(self):
        if self.phase == 0.0:
            tphase = ""
        elif (self.phase > 0):
            tphase = u" + %i\u03C0/8" % int(self.phase*8.0/pi)
        else:
            tphase = u" - %i\u03C0/8" % int(abs(self.phase*8.0/pi))
        print self.phase*8.0/pi

        txt = "y = %ssin(%sx %s)" % (simplify_num(self.amp), simplify_num(self.freq), tphase)
        return txt
    
def simplify_num(num):
    if (num == 1):
        snum = ""
    elif (num == -1):
        snum = "-"
    else:
        snum = str(num).split(".")[0]+" "
    return snum
        
amp = 1.0
freq = 1.0

damp = 1.0
dfreq = 1.0

phase = 0.0
dphase = pi/8.0

xmin = -2*pi
xmax = 2*pi
dx = 0.1

ymin = -3
ymax = 3

scene.width=640
scene.height=480

xaxis = curve(pos=[(xmin,0),(xmax,0)])
yaxis = curve(pos=[(0,ymin),(0,ymax)])

x = arange(xmin, xmax, dx)
#y = f(x)

func = sin_func(x=x)
func.update(amp, freq, phase)

while 1: #theta <= 2*pi:
    rate(60)

    if scene.kb.keys: # is there an event waiting to be processed?
        s = scene.kb.getkey() # obtain keyboard information
        #print s
        if s == "up":
            amp += damp
        if s == "down":
            amp -= damp
        if s == "right":
            freq += dfreq
        if s == "left":
            freq -= dfreq

        if s == "s":
            phase += dphase
        if s == "a":
            phase -= dphase

        func.update(amp, freq, phase)
        #update_curve(func, y)