Polar Coordinates Animation

A couple quick programs (polarGraphs.py) to create animations of the drawing of functions in polar coordinates (for my pre-Calculus class).

Graph of the function: r = 4 cos(θ)

It can export as a movie (mp4 as above). W can also transform functions (using: polarToCartesianGraph.py ) from rectangular to polar coordinates (and back: you can choose the settings).

Coordinate transforms Cartesian to Polar and back again for r = 4 cos(θ)

A Note on using ChatGPT

This python program uses the matplotlib library, and, for the first time for me, I used ChatGPT to figure out the syntax for things like drawing arcs and arrows, and exporting animation files, instead of googling my questions. ChatGPT worked great, and significantly speeded up the process. It does make me wonder, however, that since these models are based off of what they’ve scraped from the internet, are they going to run create problems for themselves if people stop asking questions on places like stackoverflow and rely on AI instead. Although, this might just mean that the AI will tend to be just be a little bit behind the cutting edge and there will continue to be a need for question and answer forums.
Python Setup on Different Operating Systems (2021)

Because students bring their own laptops and devices I’ve had some trouble in the past getting everyone running python with the packages I typically use (mainly vpython). This is a quick reference about how to get up and running on Windows, OSX, and Linux.

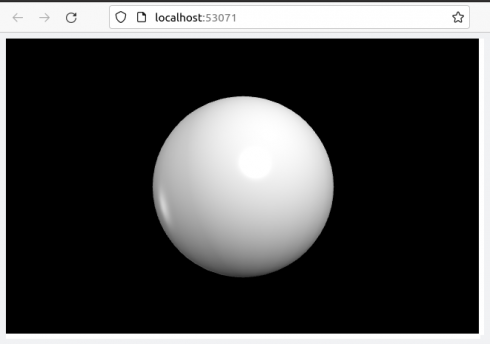
Figure 1. Test sphere (from a Linux installation).

Linux

These should be pretty identical. Ultimately, students may want to learn how to set up virtual environments (e.g. venv), however, for our purposes python3 should already be installed.

Using a Terminal window we’ll install pip:

sudo apt install python3-pip

and use pip to install vpython (which should install numpy as a dependency).

pip3 install vpython

and finally matplotlib:

pip3 install -U matplotlib

Test the installation by running python3 and making a sphere. Run:

python3

In the interpreter enter the two lines:

from vpython import *
sphere()

A new browser tab should pop up with a sphere (Figure 1).

OSX

OSX should be very similar to the Linux installation. You may have to install the latest version of python from https://www.python.org/downloads/, but you can check to see if python3 is installed by typing into a Terminal window:

python3

which will start the interpreter if python3 is installed.

Windows

Download and install the latest version of python (3.9 at the moment) from https://www.python.org/downloads/ . I then followed the instructions on Installing Packages for Windows.

The following commands will be run using the Command Prompt application:

First check that python is installed (and which version it is):

py --version

which should show something like (if it does not then something probably went wrong with the installation):

Python 3.9.7

Now install and upgrade pip (and setuptools and wheel):

py -m pip install --upgrade pip setuptools wheel

Install vpython (which includes numpy)

py -m pip install vpython

And matplotlib:

py -m pip install matplotlib

Test by opening the IDLE App, and at the interpreter prompt typing the two lines:

from vpython import *
sphere()

and you should see Figure 1 pop up in a new browser tab.

Bright and Shiny Things: Programming with LED’s

Teaching programming using the LED light strips is going much better than expected. I tried it with the 9th grade Algebra class during our weekly programming session using a set of coding lessons I put together. I went so well that though we started by having everyone (about 10 kids) share two LED strips, by the end of the year I had three students from that class build their own.

Student built LED strip.
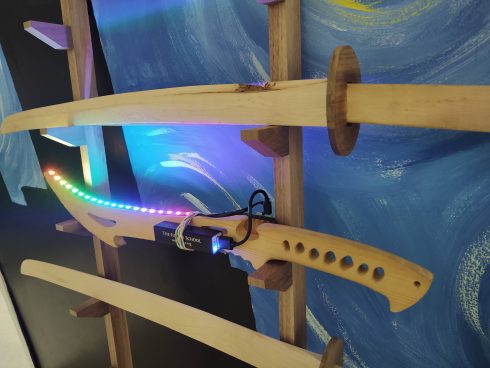
Student’s LED strip on a sword. The battery can power it for at least 15 minutes.

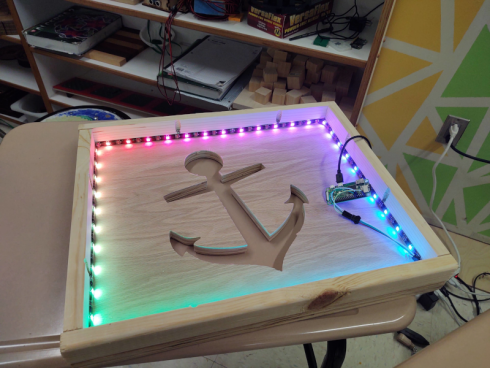
The coding lessons are still a work in progress, but it has them learn the basics by running some of the test programs, then then explore sequences using for loops. There are a lot of directions to branch off after the for loops. I’ve had some of my Algebra II students make static patterns using linear and exponential functions, while a couple of the kids in my programming class used different functions to make dynamic lighting patterns; our hydroponic system (see here and here) now has a neat LED indicator that runs different sequences depending on if the pumps are running or not.

Some of the students who built their LED strips in the Makerspace posted about their projects: LED Thingy and LED Light Strip Project. The process (rpi-led-strip) is not too hard but required them to be able to do a little physical computing (with Raspberry Pi’s), use ssh and terminal commands (terminal instructions), and then run and write python programs.

Raspberry Pi that controls one of the LED strips from a student’s project.

Since the setup uses the same GitHub repository (rpi-led-strip) it’s also easy to update some of our existing projects like the Wall Anchor.

Wall anchor project.

I am amazed at how much the students have engaged with what are, ultimately, very simple systems (a Raspberry Pi and a strip of 20 lights), and I’m really excited to see where it takes us.

Python Tutorial (on jobtensor)

In talking to alumni and their peers who have recently started computer science related careers, I have been encouraged to continue using python as the primary language for introducing students to programming.

I was recently pointed towards a very good Introduction to Python on the jobtensor website. It has a clean design and uses iPython Shells on the webpage so you can run some basic code on the site itself.

From Simple Equations to Complex Behavior

Another excellent video from Veritasium. Starts with the logistic equation and through a series of very clear examples gets to the relationship between growth rate (r) and equilibrium population. He does go into how this graph relates to the Mandelbrot set, but the rotating graphs are a little tricky to follow. However, the discussion of the practical applications of chaos theory (at 10:35) is really nice as well.

Note:

The logistic equation:

 x_{n+1} = r x_n (1-x_n)

gives the new population (xₙ₊₁) for a given growth rate (r) and the old population (xₙ).

This makes for a fairly nice and easy programming assignment.

LED Light Strip with Pi Zero

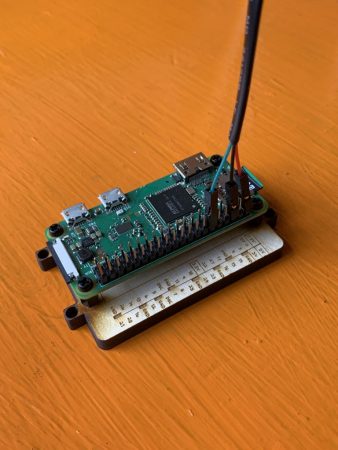
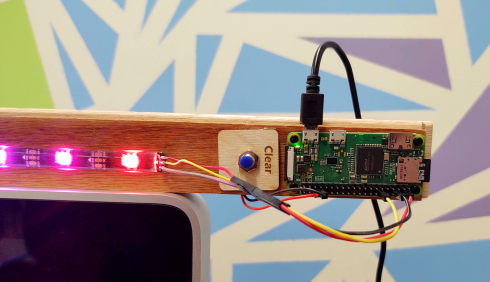
Raspberry Pi Zero controlling a LED strip, with a hardwired clear button.

I wanted to set up a small (20 LEDs) light strip using a Raspberry Pi Zero, so students could learn how to remotely log in to a device, work with the Linux command line, run python programs, and get visible, real feedback on their progress.

Instructions and code are in the Github rpi-led-strip repository.

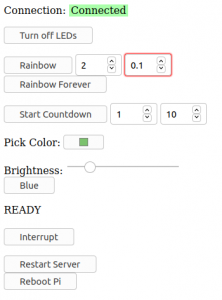
Web control for the LED strip.

The repository also has instructions and code for setting up a local server on the Pi so you can control the LED strip via a webpage. Students working on their own LED projects in the Makerspace will appreciate this.

The main idea here was to make the project as simple as possible. The web page is basic with minimal styling, so it should be easy to edit, but I do test out some of the newer HTML input elements, like the color picker. The README in the repository also includes instructions on how to, step by step, add components to the webpage to control the Pi: the “Blue” button is used as the example (it sets the entire strip to blue).

With only 20 LEDs you don’t need an external power supply so everything can be run through the Pi.

Adafruit’s CircuitPython NeoPixel library makes controlling the lights really easy. There are a few example programs in the rpi-led-strip/pyLED/ directory of the repository.

The full strip.

I’ve also included a physical button (it’s optional) that I’m using right now to just clear the LED strip. I may change it to just reboot the Pi, because I anticipate that things will get interesting when I have an entire class trying to connect to one or two devices. So far, I’ve had a small group of four students try this with some success.

HTML Animations using SVG

A basic animation test using the HTML SVG element instead of the CANVAS. This one uses the svg.js library. This library has it’s own, built in animation function that is used to make the red rectangle move back and forth (1 second period).

The green circle is moved using the requestAnimationFrame function with some coding to make it bounce back and forth.

<!DOCTYPE html>
<html lang="en" dir="ltr">
  <head>
    <script src='./svg.js/svg.min.js'></script>
    <meta charset="utf-8">
    <title></title>
  </head>
  <body>
    <div id="svgPlace"></div>
  </body>

  <script type="text/javascript">
    var draw = SVG().addTo('#svgPlace').size(300,400);
    var line = draw.line([[20,20],[200,20]]).stroke({width: 1, color:'#f00'});

    //Metronome red rectangle.
    rect = draw.rect(50,100).move(200,20).fill('#f00');
    rect.radius(10);
    dir = 'left';

    setInterval(animate, 1000);
    function animate(){
      if (dir === 'left'){
        px = 20;
        py = 20;
        dir = "right";
      }
      else {
        px = 200;
        py = 20;
        dir = "left";
      }
      rect.animate({
        duration: 1000,
        when: 'now'
      }).move(px,py);
    }

    //Green circle
    circ = draw.circle(20).fill('#0f0').move(250,10);
    window.requestAnimationFrame(animateCirc);
    cx = 250;
    cy = 20;
    dy = 1;

    function animateCirc(){
      cy+=dy;
      circ.move(cx,cy);
      window.requestAnimationFrame(animateCirc);
      if (cy > 100 ){
        cy = 100;
        dy = -dy;
      } else if (cy < 20) {
        cy = 20;
        dy = -dy;
      }
    }

  </script>
</html>

Making Animations with HTML Canvas

Based off of Mozilla’s nice introduction to basic animations on the web, I made as simple of an animation as I could using the Canvas element in HTML. It just contains a static, red rectangle, and a green sphere that slowly moves across the canvas. This should serve as a simple introduction for my students who want to make online games.

<!DOCTYPE html>
<html lang="en" dir="ltr">
  <head>
    <meta charset="utf-8">
    <title></title>
  </head>

  <body>
    <div id="gameBoard"></div>

  </body>

  <script type="text/javascript">

    canvas_width = 400;
    canvas_height = 300;

    //create canvas
    cvs = document.createElement("CANVAS");
    cvs.height = canvas_height;
    cvs.width = canvas_width;
    document.getElementById("gameBoard").append(cvs);
    ctx = cvs.getContext("2d");
    cx = 10;
    cy = 20;

    window.requestAnimationFrame(animate);

    function animate(){
      //clear the canvas
      ctx.clearRect(0, 0, canvas_width, canvas_height); // clear canvas

      //set location of the circle
      cx += .2;
      cy += .1;
      
      //recreate the canvas (every time)
      ctx.fillStyle = '#ff0000';
      rect = ctx.fillRect(0, 0, 20, 100);

      ctx.beginPath();
      circ = ctx.arc(cx, cy, 10, 0, 2 * Math.PI);
      //ctx.stroke();
      ctx.fillStyle = '#00ff00';
      ctx.fill();

      window.requestAnimationFrame(animate);

    }

  </script>
</html>

This uses plain HTML and Javascript, with no additional libraries.