A Study in Linear Equations

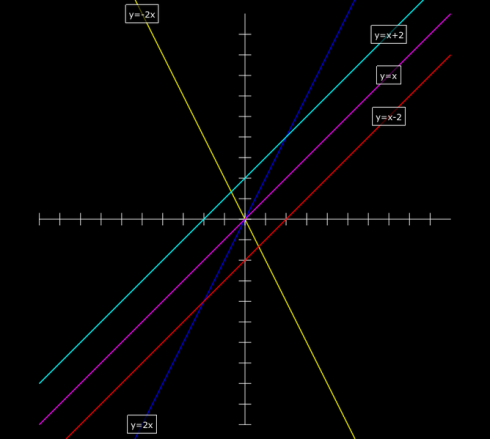
The effects of changing the constants in the equation of a line (y=mx+b). Image by Tess R.

My high school pre-Calculus class is studying the subject using a graphical approach. Since we’re half-way through the year I thought it would be useful to introduce some programming by building their own graphical calculators using Vpython.

Now, they all have graphical calculators, and Vpython does have its own graphing capabilities, but they’re fairly simple, only 2-dimensional, and way too automatic, so I prefer to have students program the calculators in full 3d space.

My approach to graphing is fairly simple too, but its nice because it introduces:

  • Co-ordinates: Primarily in 2d (co-ordinate plane), but 3d is easy;
  • Lists: in this case its a list of coordinates on a line;
  • Loops: (specifically for loops) to repeat actions and produce a sequence of numbers (with range); and
  • A sideways glance at matrix-like operations with arrays: A list of numbers can be treated like a matrix in some relatively simple circumstances. However, it’s not real matrix operations: multiplying a scalar by a list works like real matrix multiplication, but multiplying two lists multiplies the corresponding elements in the list.

A Simple Graphing Program

Start the program with the standard vpython header:

from visual import *

x and y axes: curves and lists

Next create the x and y axes. This introduces the curve object and lists, because Vpython draws its curve from a series of points held in a list.

To keep things simple, we’re letting the graph go from -10 to positive 10 along both axes, which makes the x-axis a line segment with only two points:

line_segment = [(-10,0), (10,0)]

The square brackets say that what’s inside as a list. In this case it’s a list of two coordinate pairs, (-10,0) and (10,0).

Now we create a line using Vpython’s curve and tell it that the positions of the points on the curve are the ones we just defined:

xaxis = curve(pos=line_segment)

To create the y-axis, we do the same thing but change the coordinate pair to (0,-10) and (0,10).

line_segment = [(0,-10),(0,10)]
yaxis = curve(pos=line_segment)

Which should produce:
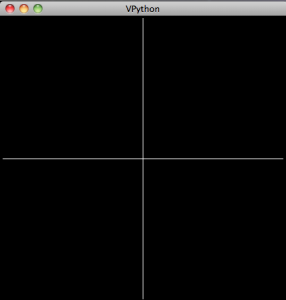
Very simple x and y axes.

Tic-marks: loops

In order to be better able to keep track of things, we’ll need some tic-marks on the axes. Ideally we’d like to label them too, but I think it works well enough to save that for later.

I start by having students create the first few tic-marks and then look for the emerging pattern. Their first attempts usually look something like this:

mark1 = curve(pos=[(-10,0.3),(-10,-0.3)])
mark2 = curve(pos=[(-9,0.3),(-9,-0.3)])
mark3 = curve(pos=[(-8,0.3),(-8,-0.3)])
mark4 = curve(pos=[(-7,0.3),(-7,-0.3)])
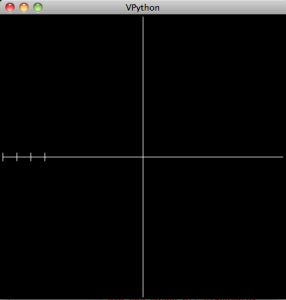
A few tic marks.

However, instead of tediously writing out these lines we can automate it by noticing that the only things that change are the x-coordinate of the coordinate pairs: they go from -10, to -9, to -8 etc.

So we want to produce a set of numbers that go from -10 to 10, in increments of 1, and use those number to make the tic-marks. The range function will do just that: specifically, range(-10,10,1). Actually, this list only goes up to 9, but that’s okay for now.

We tell the program to go through each item in the list and give its value to the variable i using a for loop:

for i in range(-10,10,1):
    mark = curve(pos=[(i,0.3),(i,-0.3)])

In python, everything indented after the for statement is within the loop.
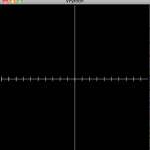
Tic marks on the x-axis.

The y-axis’ tic-marks are similar, and its a nice little challenge for students to figure them out. They usually come up with a separate loop, eventually, that looks something like:

for i in range(-10,10,1):
    mark = curve(pos=[(0.3, i),(-0.3,i)])
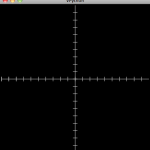
Our axes.

The Curve

Now to create a line we really only need two points. However, so that we can make other types of curves later on we’ll create a line with a series of points. We’ll create the x and y values separately:

First we set up the set of x values:

line = curve(x=arange(-10,10,0.1))

Note that I use the arange function which is just like the range function but gives you decimal values (so you can do fractions) instead of just integers.

Next we set the y values that go with the x values for the equation (in this example):
! y = 0.5 x + 2

line.y = 0.5 * line.x + 2

Finally, to make it look better, we change the color of the line to yellow:

line.color = color.yellow

In Summary

The final code looks like:

from visual import *


line_segment = [(-10,0),(10,0)]
xaxis = curve(pos=line_segment)

line_segment = [(0,-10),(0,10)]
yaxis = curve(pos=line_segment)

mark1 = curve(pos=[(-10,0.3),(-10,-0.3)])
mark2 = curve(pos=[(-9,0.3),(-9,-0.3)])
mark3 = curve(pos=[(-8,0.3),(-8,-0.3)])
mark4 = curve(pos=[(-7,0.3),(-7,-0.3)])

for i in range(-10,10,1):
    mark = curve(pos=[(i,0.3),(i,-0.3)])

for i in range(-10,10,1):
    mark = curve(pos=[(0.3, i),(-0.3,i)])


line = curve(x=arange(-10,10,0.1))
line.y = 0.5 * line.x + 2
line.color = color.yellow

which produces:
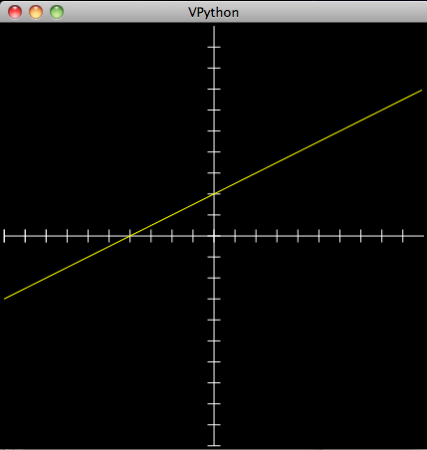
A first line: y=0.5x+2

Note on lists, arrays and matrices: You’ll notice that we create the curve, give it a list of x values (using arange), and then calculate the corresponding y values using matrix multiplication: 0.5 * line.x. This works because line.x actually stores the values as an an array, not as a list. The key difference between lists and arrays, as far as we’re concerned, is that we can get away with this type of multiplication with an array and not a list. However, an array is not a matrix, as is clearly demonstrated by the second part of the command where 2 is added to the result of the multiplication. In this case, 2 is added to each value in the array; if it were an actual matrix you need to add another matrix of the same shape that’s filled with 2’s. Right now, this is invisible to the students. The line of code makes sense. The concern is that when they do start working with matrices there might be some confusion. So watch out.

And to make any other function you just need to adjust the final line. So a parabola:
! y = x^2
would be:

line.y = line.x**2

(The two stars “**” indicates an exponent).

An Assignment

So, to assess learning, and to review the different functions we’ve learned, I asked students to produce “studies” of the different curves by demonstrating what happens when you change the different constants and coefficients in the equation.

For a straight line the general equation is:
! y = mx + b

you what happens when:

  • m > 1;
  • 0 < m < 1;
  • m < 0

and:

  • b > 1;
  • 0 < b < 1;
  • b < 0

The result is, after you add some labels, looks something like the image at the very top of this post.

This type of exercise can be done for polynomials, exponential, trigonometric, and almost any other type of functions.
How Long does it Take to Make a Vpython Program?

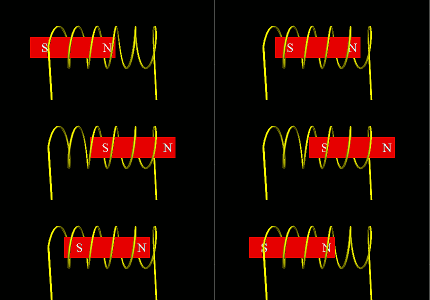
Moving the magnet through a wire coil creates an electric current in the wire. Animation captured from the VPython program: Magnetic Induction - Coils.

My students asked me this question the other day, and while slapping together an animation of electromagnetic induction I gave it some thought.

This program itself is really simple. It took about 15 minutes.

But that’s not counting the half hour I spent searching the web for an image I could use to illustrate magnetic induction and not finding one I could use.

Nor does it count the four hours I spent after I got the animation working to get the program to take screen captures automatically. Of course, I must admit that figuring out the screen captures would have gone a lot quicker if I’d not had to rebuild all my permissions on my hard drive (I’d recently reformatted it), and reinstall ImageMagick and gifsicle to take the screen captures and make animations.

Equations of a Parabola: Standard to Vertex Form and Back Again

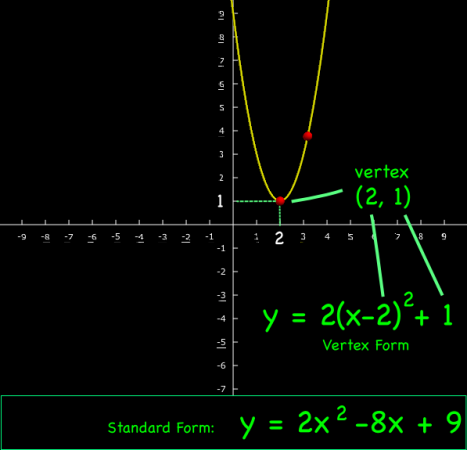
Highlighting the Vertex Form of the equation for a parabola.

The equation for a parabola is usually written as:

Standard form:
! y = ax^2 + bx + c

where a, b and c are constants. This is the form displayed in both the VPython Parabola and Excel parabola programs. However, to make the movement of the curve easier, the VPython program also uses the vertex form of the equation internally:

Vertex Form:
! y = a(x-h)^2 + k

where the point (h, k) is the location of the vertex of the parabola. In the example above, h = 1 and k = 2.

To translate between the two forms of the equation, you have to rewrite them. Start by expanding the vertex form:

y = a(x – h)2 + k

becomes:

y = a(x – h)(x – h) + k

multiplied out to get:

y = a(x2 – 2hx + h2) + k

now distribute the a:

y = ax2 – 2ahx + ah2 + k

finally, group all the coefficients:

y = (a)x2 – (2ah)x + (ah2 + k)

This equation has the same form as y = ax2 + bx + c if:

Vertex to Standard Form:

a = a
b = -2ah
c = ah2+k

And we can rearrange these equations to go the other way, to find the vertex form from the standard form:

Standard to Vertex Form:

! a = a
! h = \frac{\displaystyle -b}{\displaystyle 2a}
! k = c - ah^2 = c - \frac{\displaystyle b^2}{\displaystyle 4a}

Summary

In sum, you can write the standard equation for a parabola as:

Standard form:

And you can write the equation for the same parabola in vertex form as:

Vertex form:

UPDATES

UPDATE 1: This app will automatically convert from standard to vertex form (or back again).

UPDATE 2: Automatically generate and embed graphs using this parabolic grapher app.

Considering LEGO Robotics

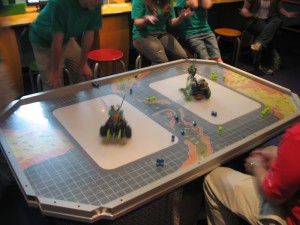
LEGO robots at the St. Louis Science Center.

There was a neat little conference today, organized by LEGO’s Education division. I’ve been trying to figure out a way to include robotics in my math and science classes, but since I haven’t had the time to delve into it, I was wondering if the LEGO Robotics sets would be an easy way to get started. It turns out that they have a lot of lesson plans and curricula available that are geared for kids all the way from elementary to high school, so I’m seriously considering giving it a try.

Pedagogically, there are a lot of good reasons to integrate robotics into our classes, particularly as the cornerstone of a project-based-learning curriculum.

  • The act of building robots increases engagement in learning. Just like assembling Ikea furniture makes people like it better, when students build something the accomplishment means more to them.
  • Working on projects builds grit, because no good project can succeed without some obstacles that need to be overcome. Success comes through perseverance. Good projects build character.
  • The process of building robots provides a sequence of potential “figure it out” moments because of the all steps that go into it, especially when students get ambitious about their projects. And students learn a whole lot more when they discover things on their own.
  • Projects don’t instill the same stress to perform as do tests. Students learn that learning is a process where you use your strengths and supplement your weaknesses to achieve a goal. They learn that their worth is more than the value of an exam.
  • Projects promote creativity, not kill it like a lot of traditional education.

In terms of the curriculum, Physics and Math applications are the most obvious: think about combining electronics and simple machines, and moving robots around the room for geometry. A number of the presenters, Matthew Collier and Don Mugan for example, advocate for using it across the curriculum. Mugan calls it transdisciplinary education, where the engineering project is central to all the subjects (in English class students do research and write reports about their projects).

I’ve always favored this type of learning (Somewhat in the Air is a great example), but one has to watch out to make sure that you’re covering all the required topics for a particular subject. Going into one thing in depth usually means you have to sacrifice, for the moment at least, some width. The more you can get free of the strictures of traditional schooling the better, because then you don’t have to make sure you hit all the topics on the physics curriculum in the seemingly short year that you officially teach physics.

The key rules about implementation that I gleaned from presentations and conversations with teachers who use the LEGO robotics are that:

  • Journaling is essential. Students are going to learn a lot more if they have to plan out what they want to do, and how to do it, in a journal instead of just using trial-and-error playing with the robots.
  • Promote peer-teaching. I advocate peer teaching every chance I get; teaching is the best way to learn something yourself.
  • 2 kids per kit. I heard this over and over again. There are ways of making larger groups work, but none are ideal.

A Plan of Action

So I’m going to try to start with the MINDSTORM educational kit, but this requires getting the standard programming software separately. One alternative would be to go with the retail kit, which is the same price and has the software (although I don’t know if anything else is missing).

I think, however, I’ll try to get the more advanced LabVIEW software that seems to be used usually for the high school projects that use the more sophisticated TETRIX parts but the same microcontroller brick as the MINDSTORM sets. LabVIEW might be a little trickier to learn, but it’s based on the program used by engineers on the job. Middle and high students should be able to handle it. But we’ll see.

Since LabVIEW is more powerful, it should ease the transition when I do upgrade to the TETRIX robots.

The one potential problem that came up, that actually affects both software packages, is that they work great for linear learners, but students with a more random access memory will likely have a harder time.

At any rate, not I have to find a MINDSTORM set to play with. Since I’m cheap I’ll start by asking around the school. Rumor has it that there was once a robotics club, so maybe someone has a set sitting around that I can burrow. We’ll see.

Algebra in Programming, and a First Box

One of the first things you learn in algebra is to use variables to represent numbers. Variables are at the heart of computer programming, and in Python you can use them for more than just numbers. So open the IDLE text editor and get to work.

But first we’ll start with numbers. To assign a number to a variable you just write an equation. Here are a couple (you can copy and paste the code into the IDLE window, but usually typing it in yourself tends to be more meaningful and help you remember):

a = 2
b = 3

Now we can add these two variables together and create a new variable c.

a = 2
b = 3
c = a + b

Which is all very nice, but now we want our program to actually tell us what the result is so we print it to the screen.

a = 2
b = 3
c = a + b
print c

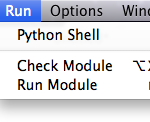
Run this program (F5 or select “Run Module” in the “Run” menu) to get:

Output from the first program: 2+3=5.

Basic Operations and Types of Numbers

Now try some other basic operations:

+ and – are easy as you’ve seen above.

× : for multiplication use *, as in:

a = 2
b = 3
c = a * b
print c

÷ : to divide use a /, as in:

a = 2
b = 3
c = a / b
print c

Now as you know, 2 divided by 3 should give you two thirds, but the running this program outputs 0:

2 divided by 3 to gives 0 because Python thinks we're working with integers.

This is because the Python thinks you’re using integers (a whole number), so it gives you an integer result. If you want a fraction in your result, you need to indicate that you’re using real numbers, or more specifically, rational numbers, which can be integers or fractions, but usually show up as a decimal (these are usually referred to as floating point numbers in programming).

The easiest way to indicate that you don’t just want integers is to make one of your original numbers a decimal:

a = 2.0
b = 3
c = a / b
print c

which produces:

Use a = 2.0 to indicate that we're using rational numbers.

Other Things Can Be Variables

In object oriented programming languages like Python you can assign all sorts of things to variables, not just numbers.

To create a box and give it a variable name you can use the program:

from visual import *
c = box()

which produces:

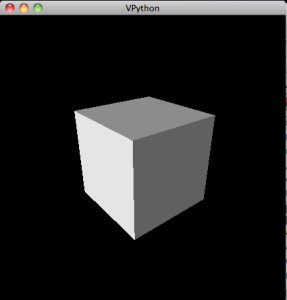
A box created with VPython. It looks much more interesting if you rotate it to see it in perspective.

A rotated, zoomed-out view of a box.

To rotate the view, hold down and drag the right mouse button. To zoom in or out, hold down the right and left buttons together and drag in and out. Mac users will probably have to use the “option” button to zoom, and the “command” button to rotate.

The line from visual import * tells the computer that it needs to use all the stuff in the module called “visual”, which has all the commands to make 3d objects (the “*” indicates all).

The c = box() line creates the box and assigns it a variable name of c. You don’t just have to use letters as variable names. In programming you want to use variable names that will remind you of what it’s supposed to represent. So you could just as well have named your variable “mybox” and gotten the same result:

from visual import *
mybox = box()

Now objects like this box have properties, like color. To make the box red you set the color property in one of two ways. The first method is to set the color as you create the object:

from visual import *
mybox = box(color = color.red)

The second is to set the property using the variable you’ve created and “dot” (.) notation.

from visual import *
mybox = box()
mybox.color = color.red

In both of these color.red is a variable name that the computer already knows because it was imported when you imported the “visual” module. There are a few other named colors like color.green and color.blue that you can find out more about in the VPython documentation (specifically here).

You can also find out about the other properties boxes have, like length, width and position (pos), as well as all the other objects you can create, such as springs, arrows and spheres.

At this point, its probably worth spending a little time creating new objects, and varying their properties.

Overview

We’ve just covered:

  • Assigning values to variables
  • Basic operations (+,-,×, and ÷)
  • Types of Numbers: Integers versus floating point
  • Assigning 3d objects to variables
  • Setting properties of 3d objects

Next we’ll try to make things move.

References

For how to install and run VPython, check here.

Algebra and Programming with VPython

Computer programming is the place where algebra comes to life. Students seem to get really excited when they write even the simplest instructions and see the output on the screen. I’m not sure exactly why this is the case, but I suspect it has something to do with being able to see the transition from abstract programming instructions to “concrete” results.

So I’ve decided to supplement my Algebra classes with an introduction to programming. I’m using the Python programming language, or, more specifically, the VPython variant of the language.

Why VPython? Because it’s free, it’s an easy-to-use high-level language, and it’s designed for 3d output, which seems to be somewhat popular these days. The oohs and aahs of seeing the computer print the result of a+b turn into wows when they create their first box. I’ve used the language quite a bit myself, and there are a lot of other interesting applications available if you search the web.

VPython was created to help with undergraduate physics classes, but since it was made to be usable by non-science majors, it’s really easy for middle and high school students to pick up. In fact, NCSU also has a distance education course for high school physics teachers. They also have some instructional videos available on YouTube that provide a basic introduction.

Image from a game created by middle school student Ryan W.

I use VPython models for demonstrations in my science classes, I’ve had middle school students use it for science projects, and I’ve just started my middle school algebra/pre-algebra students learning it as a programming language and they’re doing very well so far.

What I hope to document here is the series of lessons I’m putting together to tie, primarily, into my middle school algebra class, but should be useful as a general introduction to programming using VPython.

Getting VPython

You’ll need to install Python and VPython on your system. They can be directly downloaded from the VPython website’s download page for Windows, Macintosh or LINUX.

Running a Python program.

Once they’re installed, you’ll have the IDLE (or VIDLE) program somewhere on your system; a short-cut is usually put on the desktop of your Windows system. Run (double-click) this program and the VPython programming editor will pop up any you’re ready to go. You can test it by typing in something simple like:

a = 1
b = 2
c = a + b
print c

Then you run the program by going through the Run–>Run Module in the menu bar.

Which should cause a new window to pop up with:

Python 2.7.1 (r271:86882M, Nov 30 2010, 09:39:13) 
[GCC 4.0.1 (Apple Inc. build 5494)] on darwin
Type "copyright", "credits" or "license()" for more information.
>>> ================================ RESTART ================================
>>> 
3
>>> 

Even better might be to test the 3d rendering, which you can do with the following program:

from visual import *

box()

which creates the following exciting image:

A box created with VPython. It looks much more interesting if you rotate it to see it in perspective.

To rotate the view, hold down and drag the right mouse button. To zoom in or out, hold down the right and left buttons together and drag in and out.

A rotated, zoomed-out view of a box.

Lessons

Lesson 1: Variables, Basic Operations, Real and Integer Numbers and the First Box.

Lesson 2: Creating a graphical calculator: Coordinates, lists, loops and arrays: A Study in Linear Equations