Volumes of Rotation: The Disk Method: 3d with Javascript Three.js

Finally, relatively easy interactive 3d on the web. You can rotate and zoom into the scene. (Although it may not yet be compatible with all browsers it does work with Firefox at least).

This method uses the three.js Javascript library. Here I use it to show the volume of a rotated surface using the disk method. It’s almost identical to my calculus student’s project, except here I’m finding the volume between x=1 and x=3, using disks that are 0.5 units in height (Δx).

Since the volume of cylinder is:

 V_{cylinder} = \pi r^2 h

where r is the radius of the cylinder.

We’re finding the volume created by a function that’s rotated around the x-axis. Using the function:

 y = -\frac{x^2}{4}+4

The radius of each cylinder is the value of the function for that x value, so you could write the radius as:

 R(x) = -\frac{x^2}{4}+4

Therefore the volume of each disk is:

 V_{disk} = \pi R(x)^2 \Delta x

There are four disks and we use the function value at the far end of the disk to draw the disk so the total volume is:

 V = \pi R(1.5)^2 \Delta x + \pi R(2.0)^2 \Delta x + \pi R(2.5)^2 \Delta x + \pi R(3.0)^2 \Delta x

Factoring out the π and the Δx gives:

 V = \pi \Delta x \left(R(1.5)^2 +  R(2.0)^2 + R(2.5)^2  +  R(3.0)^2 \right)

Since Δx = 0.5, a = 1.0, and b = 3.0, we can define the number of disks as n = 4 then we can rewrite using summation formula:

 V = \pi \Delta x \sum\limits_{i=1}^n R(1.0+i \Delta x)^2

reverting back to a and b gives the general equation:

 V = \pi \Delta x \sum\limits_{i=1}^n R(a+i \Delta x)^2

where:
 n = \frac{b-a}{\Delta x}

Anatronica: 3d Anatomy Online

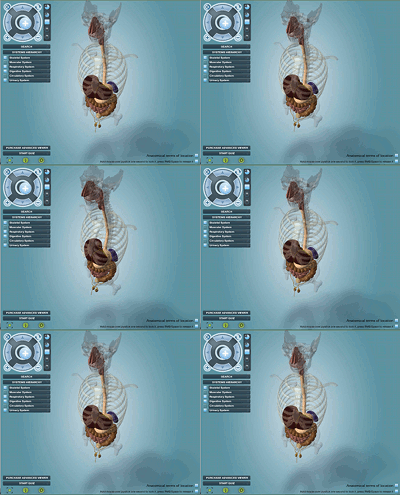
Screen captures from Anatronica's Anatomy 3D Systems website. The digestive system is highlighted, while the skeletal system is shown semi-transparently for context.

Anatronica has an excellent, online, 3d viewer for the anatomy of the human torso. While it’s not quite the same as a physical model, it’s pretty good as a study guide for middle schoolers.

Seeing temperature, kinetic energy and color

We read that temperature is the average kinetic energy of a substance but you can (especially if you’re a visual learner) nicely internalize this from simple videos or animations. UCAR has a little animation with their definition of temperature. I however, adapted an interactive, 3d animation that I think does a nice job, and also introduces a couple of other interesting concepts too.

I’ve also used this model, at different times, to show:

  • The relationship between temperature and color emitted by objects. The main way we know the temperature of stars is because blue stars are hotter than red stars. Blue light has a shorter wavelength than red light, and things that are at higher temperatures emit shorter wavelengths.
  • Absolute zero (0 Kelvin) – where (almost) all motion stops and the objects stop emitting light.
  • Pressure in a gas – you really get a feel for the force exerted by the particles on the side of the box (although it might be even more interesting once I figure out how to add sound).

It is an interactive model, but it’s pretty simple because the only control is a slider that lets you set the temperature.

Finally, in the age of 3d movies, like Avatar, the models can be easily shown in 3d if you have the glasses (redcyan).

The model is easy to install and run on Windows, but you have to install the programming language VPython separately on a Mac (but that isn’t very hard). I have this, and a bunch of other models, at http://earthsciweb.org/GeoMod/.