Tsunami Geometry: Calculating the Height of a Tsunami using Basic Geometry

Since we’re working on geometry this cycle, I thought it would be an interesting exercise to think about how we could use geometry to think about how the strength of tsunamis decreases with distance from the source.

Of course, we’ll have to do this using some intense simplification so we can actually apply the tools we have available. The first is to approximate the tsunami as a circular wall of water centered on the epicenter of the earthquake.

Simplified tsunami geometry.

This lets us figure out the volume of the wave pretty easily because we know that the volume of a cylinder is:

(1) ! V_c = \pi r^2 h

The size of the circular water wall we approximate from the reports from Japan. The maximum height of the wave at landfall was somewhere in the range of 14 m along the northern Japanese coast, which was about 80 km from the epicenter. Just as a wild guess, I’m assuming that the “effective” width of the wave is 1 km.

Typically, in deep water, a tsunami can have a wavelength greater than 500 km (Nelson, 2010; note that our width is half the wavelength), but a wave height of only 1 m (USSRTF). When they reach the shallow water the wave height increases. The Japanese tsunami’s maximum height was reportedly about 14 m.

At any rate, we can figure out the volume of our wall of water by calculating the volume of a cylinder with the middle cut out of it. The radius of our inner cylinder is 80 km, and the radius of the outer cylinder is 80 km plus the width of the wave, which we say here is 1 km.

Calculating the volume of the wave

However, for the sake of algebra, we’ll call the radius of the inner cylinder, ri and the width of the wave as w. Therefore the inner cylinder has a volume of:

(2) ! V_i = \pi r_i^2 h

So the radius of the outer cylinder is the radius of the inner cylinder plus the width of the wave:

(3) ! r_o = r_i + w

which means that the volume of the outer cylinder is:

(4) ! V_o = \pi (r_i + w)^2 h

So now we can figure out the volume of the wave, which is the volume of the outer cylinder minus the volume of the inner cylinder:

(5) ! V_w = V_o - V_i

(6) ! V_w = \pi (r_i + w)^2 h - \pi r_i^2 h

Now to simplify, let’s expand the first term on the right side of the equation:

(7) ! V_w = \pi (r_i ^2 + 2 r_i w + w^2) h - \pi r_i^2 h

Now let’s collect terms:

(8) ! V_w = \pi h \left( (r_i ^2 + 2 r_i w + w^2)  - r_i^2 \right)

Take away the inner parentheses:

(9) ! V_w = \pi h (r_i ^2 + 2 r_i w + w^2  - r_i^2)

and subtract similar terms to get the equation:

(10) ! V_w = \pi h ( 2 r_i w + w^2 )

Volume of the wave

Now we can just plug in our estimates of width and height to get the volume of water in the wave. We’re going to assume, later on, that the volume of water does not change as the wave propagates across the ocean.

(11) ! V_w =  \pi (14)  ( 2 r_i (1000) + (1000)^2 )

rearrange so the coefficients are in front of the variables:

(12) ! V_w =  14 \pi  ( 2000 r_i  + 1000000 )

So, at 80 km, the volume of water in our wave is:

(13) ! V_w =  14 \pi  ( 2000 (80000)  + 1000000 )

(14) ! V_w =  7081149841  m^3

Height of the Tsunami

Okay, now we want to know what the height of the tsunami will be at any distance from the epicenter of the earthquake. We’re assuming that the volume of water in the wave remains the same, and that the width of the wave also remains the same. The radius and circumference will certainly change, however.

We take equation (10) and rearrange it to solve for h by first dividing by rearranging all the terms on the right hand side so h is at the end of the equation (this is mostly for clarity):

(15) ! V_w = \pi ( 2 r_i w + w^2 )  h

Now we can divide by all the other terms on the right hand side to isolate h:

(16) ! \frac{V_w}{\pi ( 2 r_i w + w^2 )} = \frac{\pi ( 2 r_i w + w^2 )  h}{\pi ( 2 r_i w + w^2 )}

so:

(17) ! \frac{V_w}{\pi ( 2 r_i w + w^2 )} = h

which when reversed looks like:

(18) ! h = \frac{V_w}{\pi ( 2 r_i w + w^2 )}

This is our most general equation. We can use it for any width, or radius of wave that we want, which is great. Anyone else who wants to calculate wave heights for other situations would probably start with this equation (and equation (15)).

Double checking our algebra

So we can now figure out the height of the wave at any radius from the epicenter of the earthquake. To double check our algebra, however, let’s plug in the volume we calculated, and the numbers we started off with, and see if we get the same height (14 m).

First, we’ll use all our initial approximations so we get an equation with only two variables: height (h) and radial distance (ri). Remember our initial conditions:

w = 1000 m
ri = 80,000 m
hi = 14 m

we used these numbers in equation (10) to calculate the volume of water in the wave:

Vw = 7081149841 m3

Now using these same numbers in equation (18) we get:

(19) ! h = \frac{7081149841}{\pi ( 2 (r_i) (1000) + (1000)^2 )}

which simplifies to:

(20) ! h = \frac{7081149841}{ 2000 r_i \pi + 1000000 \pi }

So, to double-check we try the radius of 80 km (80,000 m) and we get:

h = 14 m

Aha! it works.

Across the Pacific

Now, what about Hawaii? Well it’s about 6000 km away from the earthquake, so taking that as our radius (in meters of course), in equation (20) we get:

(21) ! h = \frac{7,081,149,841}{ 2,000 (6,000,000) \pi + 1,000,000 \pi }

which is:

h = 0.19 m

This is just 19 cm!

All the way across the Pacific, Lima, Peru, is approximately 9,000 km away, which, using equation (20) gives:

h = 0.13 m

So now I’m curious about just how fast the 14 meters drops off to less than 20 cm. So I bring up Excel and put together a spreadsheet of tsunami height at different distances. Plot on a graph we get:

Tsunami heights with distance from earthquake, assuming a circular wall of water.

So the height of the tsunami drops off relatively fast. Within 1000 km of the earthquake the height has dropped by 90%.

How good is this model

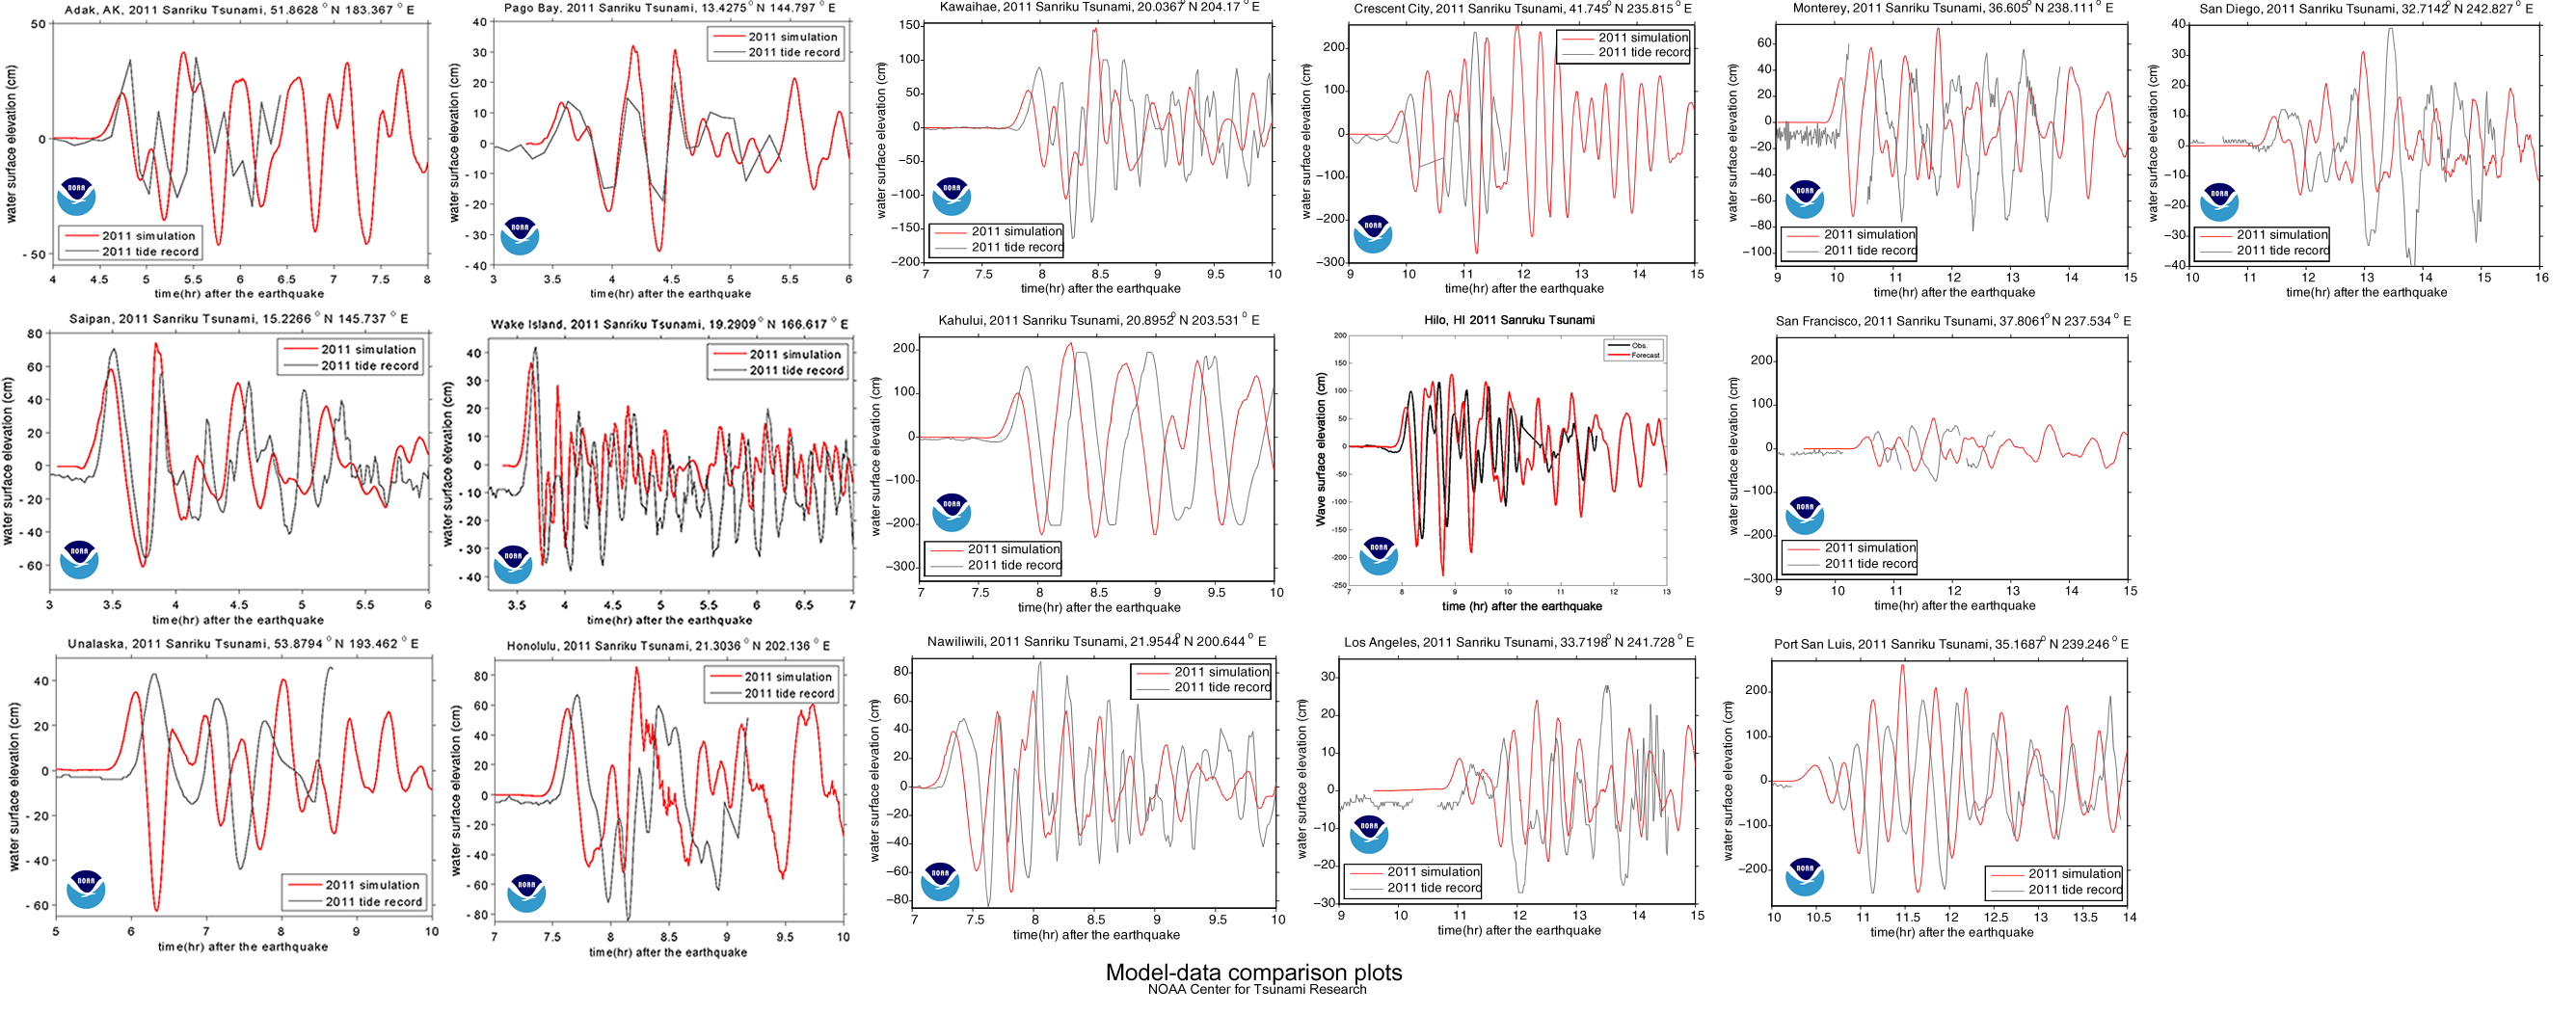
This is all very nice, a cute little exercise in algebra, but is it useful? Does it come anywhere close to reality? We can check by comparing it to actual measurements; the same ones used by NOAA to compare to their model (see here).

The red line is the tsunami's water height predicted by the NOAA computer models for Honolulu, Hawaii, while the black line is the actual water height, measured at a tidal gauge. Other comparisons can be found here.
Tsunami wave heights in the Pacific, as modeled by NOAA. Notice how the force of the tsunami is focused across the center of the Pacific.

The graph shows a maximum height of about 60 cm, which is about three times larger than our model. NOAA’s estimate is within 20% of the actual maximum heights, but they’ve spent a bit more time on this problem, so they should be a little better than us. You can find all the gruesome details on NOAA’s Center for Tsunami Research site’s Tsunami Forecasting page.

Notes

1. The maximum height of a tsunami depends on how much up-and-down motion was caused by the earthquake. ScienceDaily reports on a 2007 article that tried to figure out if you could predict the size of a tsunami based on the type of earthquake that caused it.

2. Using buoys in the area, NOAA was able to detect and warn about the Japanese earthquake in about 9 minutes. How do they know where to place the buoys? Plate tectonics.

The locations of the buoys in NOAA's tsunami warning system.

Update

The equations starting with (7) did not have the 2 on the riw term. That has been corrected. Note that the numerical calculations were correct so they have not changed. – Thanks to Spencer and Claude for helping me catch that.

Radiation dosages

Radiaton dosages from different sources. Graph by http://xkcd.com/radiation/.

xkcd has published an excellent graph showing where different dosages of radiation come from and how they affect health. It’s a complex figure, but it’s worth taking the time to look through. I find it easiest to interpret going backward from the bottom right corner that show the dosages that are clearly fatal.

One Seivert (1 Sv).

One red square of 100 red blocks is equal to one seivert, which is the radiation dosage that will kill you if you receive it all at once. Note:

  • If you were next to the reactor core during the Chernobyl nuclear accident, you would have gotten blasted by 50 Sv.
  • 8 Sv will kill you, even with treatment.
  • Getting 0.1 Sv over a year is clearly linked to cancer.
  • One hour on the grounds of the Chernobyl nuclear plant (in 2010) would give you 0.006 Sv.
  • Your normal, yearly dose is about 0.004 Sv, just about how much was measured over a day at two sites near Fukushima.
  • Eating a banana will give you 0.000001 Sv.

While I did not find equivalent exposure levels, the nuclear bombs dropped on Hiroshima and Nagasaki lead to many deaths and sickness from radiation created by the explosions. Within four months, there were 140,000 fatalities in Hiroshima, and 70,000 in Nagasaki (Nave, 2010). The Manhattan Engineer District, 1946 report describes the radiation effects over the first month:

Radiation effects for the month following the dropping of the nuclear bombs on Nagasaki and Hiroshima. (Table from The Manhattan Engineer District (1946) via atomicarchive.com).

The effects were not limited to the explosion itself, though. There is one estimate, that 260,000 people were indirectly affected:

Radiation dose in a zone 2 kilometers from the hypocenter of the atomic bomb was the largest. Also, those who entered the city of Hiroshima or Nagasaki soon after the atomic bomb detonation and people in the black rain areas were exposed to radiation. … some people were exposed to radiation from black rain containing nuclear fission products (“ashes of death”), and others to radiation induced by neutrons absorbed by the soil upon entering these cities soon after the atomic bomb detonation.

— Hiroshima International Council for Health Care for the Radiation Exposed (HICARE): Global Radiation Exposures.

HICARE also has a good summary of what happened at Chernobyl, where 31 people died at the time of the accident, about 400,000 were evacuated, and anywhere between 1.6 and 9 million people were exposed to radiation. Modern pictures of the desolation of Chernobyl are here. The Wikipedia article has before and after pictures of Hiroshima and Nagasaki.

Volcanic eruption in Japan: Shinmodake

Shinmodake Volcano in southern Japan (center). This picture predates the big earthquake. Image from NASA Earth Observatory: Shinmoe-dake Volcano Erupts on Kyushu..

The Shinmoedake Volcano erupted on January 19th after being dormant for two years, however, two days after the big Japanese earthquake, it began spewing ash once again. The two are not necessarily connected.

Volcanos and convergent margins go together. Typically, the plate being subducted melts as it is pushed deeper into the Earth and temperatures rise. It also helps that the water in the crust and sediment of the subducting plate makes it easier to melt, and makes the resulting magma much more volatile and explosive.

The subducting plate melts producing volatile magma.

But although Shinmoedake is in Japan, it is not on the same tectonic boundary as the earthquake. The northern parts of Japan are where the Pacific Plate is being subducted beneath the Okhotsk Plate. This volcano is connected to the subduction of the Philippine Plate to the south.

The large earthquake's epicenter and the Shinmoedake volcano are on different plate margins. Image adapted from Wikimedia Commons user Sting.

This does not necessarily mean that the two occurrences are totally unrelated. Seismic waves from the big earthquake could have been enough to incite magma chambers that were just about ready to blow anyway.

The map below is centered on the series of craters in the region of the erupting volcano.


View Larger Map

Tsunami

The tsunami spawned by the recent earthquake off Japan did most of the damage we know about so far. The U.S. National Oceanic and Atmospheric Administration’s Center for Tsunami Research uses computer models to forecast, and provide warnings about, incoming tsunami waves. They have an amazing simulation showing the propagation of the recent tsunami across the Pacific Ocean (the YouTube version is here).

Images captured from the NOAA simulation. The full resolution, 47Mb video can be found here, on NOAA's site.

They’ve also posted an amazing graphic showing the wave heights in the Pacific Ocean.

Tsunami wave heights modeled by NOAA. Note the colors only go up to 2 meters. The maximum wave heights (shown in black in this image), near the earthquake epicenter, were over 6 meters.

Of course, these are the results of computer simulations. As scientists, the people at NOAA who put together these plots are always trying to improve. Science involves a continuous series of refinements to better understand the world we live in, so the NOAA scientists compare their models to what really happen so they can learn something and do better in the future. Perhaps the best way to do this for the tsunami is by comparing the predictions of their models to the actual water height measured by tidal gages:

The red line is the tsunami's water height predicted by the NOAA computer models for Honolulu, Hawaii, while the black line is the actual water height, measured at a tidal gauge. Other comparisons can be found here.

You’ll notice that NOAA did not do a perfect job. They did get the amplitude (height) of the waves mostly right, but their timing was a little off. Since it’s about 6000 km from the earthquake epicenter to Honolulu, being off by a few minutes is no mean feat. Yet I’ll bet they’re still working on making it better, particularly since some of the other comparisons were not quite as good.

Finally, if you were wondering, attempting to surf a tsunami is not a good idea. For one thing, there is no nice face to surf on:

… a tsunami wave approaching land is more like a wall of whitewater. …. Since the wave is 100 miles long and the tail end of the wave is still traveling at 500 mph, the shore end of the wave becomes extremely thick, and is forced to run far inland, over streets and trees and houses. …. And remember, the water isn’t clean, but filled with everything dredged up from the sea floor and the land the wave runs over–garbage, parking meters, pieces of buildings, dead animals.

— Natural Hazards Hawaii, University of Hawaii at Hilo: Why you can’t surf a tsunami

UPDATE: Terrifying video of the tsunami:

Nuclear Meltdown in Japan

CNN has an informative interview on the explosion at the Fukushima nuclear plant in Japan after the earthquake and tsunami.

Footage of the explosion from the BBC:

Nuclear disasters are so rare that they’re easy to forget about when we’re talking about the right mix of alternative (non-carbon based) energy sources for the future.

Right after the accidents at Three Mile Island in 1979 and Chernobyl in 1986, awareness of the dangers lead to a de facto moratorium on nuclear power plants in the U.S.. This was good in that people were now treating nuclear power much more respectfully, and incorporating the costs of potential accidents into their calculations. However, it also reduced the interest and effort of developing newer and safer types of nuclear plants.

We’ll have this discussion next year when we focus more on the physical sciences.

UPDATE:

1. More details on how nuclear plants work can be found in Maggie Koerth-Baker’s post, Nuclear energy 101: Inside the “black box” of power plants.

Fukushima reactor status as of March 16th, 5:00 pm GMT from the Guardian live blog.

2. The Guardian’s live blog has good, up-to-date information on the status of the nuclear reactors at Fukushima.

Plate Tectonics and the Earthquake in Japan

The magnitude 8.9 earthquake that devastated coastal areas in Japan shows up very clearly on the United States Geologic Survey’s recent earthquake page.

The big red square marks an aftershock of the magnitude 8.9 earthquake off Japan. (Image via USGS). Note that most of the earthquakes occur around the edge of the Pacific Ocean (and the Pacific Plate).

Based on our studies of plate tectonics, we can see why Japan is so prone to earthquakes, and we can also see why the earthquake occurred exactly where it did.


View Larger Map

The obvious trench to the east and the mountains and volcanoes of the Japanese islands indicate that this is a convergent margin. The Pacific plate is moving westward and being subducted beneath the northern part of Japan, which is on the Okhotsk Plate.

The tectonic plates and their boundaries surrounding Japan. The epicenter of the earthquake is along the convergent margin where the Pacific Plate is being subducted beneath the Okhotsk Plate. Image adapted from Wikimedia Commons user Sting.

The epicenter of the earthquake is on the offshore shelf, and not in the trench. Earthquakes are caused by breaking and movement of rocks along the faultline where the two plates collide.

In cross-section the convergent margin would look something like this:

Diagram showing the tectonic plate movement beneath Japan. Note the location of the earthquake is beneath the offshore shelf and not in the trench.

The shaking of the sea-floor from the earthquake creates the tsunamis.

So where are there similar tectonic environments (convergent margins)? You can use the Google Map above to identify trenches and mountain ranges around the world that indicate converging plates, or Wikimedia Commons user Sting’s very detailed map, which I’ve taken the liberty of highlighting the convergent margins (the blue lines with teeth are standard geologists’ markings for faults and, in this case, show the direction of subduction):

Convergent plate boundaries (highlighted blue lines) shown on a world map of tectonic boundaries. The blue lines with teeth are standard geologic symbols for faults, with the teeth showing the direction of the fault underground. Image adapted from Wikimedia Commons user Sting.

The Daily Dish has a good collection of media relating to the effects of the quake, including footage of the tsunami inundating coastal areas.

Cars being washed away along city streets:

Our thoughts remain with the people of Japan.

UPDATES:

1. Alan Taylor has collected some poignant pictures of the flooding and fires caused by the tsunami and earthquake. TotallyCoolPix has two pages dedicated to the tsunami so far (here and here).

2. Emily Rauhala summarizes Japan’s history of preparing for this type of disaster. They’ve done a lot.

3. Mar 12, 2011. 2:10 GMT: I’ve updated the post to add the map of the tectonic plates surrounding Japan.

4. A CNN interview that includes video of the explosion at the Fukushima nuclear power plant (my full post here).

5. NOAA has an amazing image showing the tsunami wave heights.

Tsunami wave heights modeled by NOAA. Note the colors only go up to 2 meters. The maximum wave heights (shown in black in this image), near the earthquake epicenter, were over 6 meters.

They also have an excellent animation showing the tsunami moving across the Pacific Ocean. (My post with more details here).

6. The United States Geological Survey (USGS) put out a podcast on the day of the earthquake that has interviews with two specialists knowledgeable about the earthquake and the subsequent tsunami, respectively. Over 250 kilometers of coastline moved in the earthquake which is why the tsunami was so big. They also have a shakemap, that shows the area affected by the earthquake.

USGS ShakeMap for the earthquake. Image via the USGS.

7. ABC News (Australia) and Google have before and after pictures.

8. The University of Hawaii has a page about, Why you can’t surf a tsunami.

9. A detailed article on earthquake warning systems, among which, “Japan’s system is among the most advanced”, was recently posted in Scientific American.

10. Mar 15, 2011. 9:15 GMT: I’ve added a map of tectonic boundaries highlighting convergent margins.

Shinmoedake Volcano.

11. The Shinmoedake Volcano erupted two days after the earthquake, but they may be unrelated.

Fukushima reactor status as of March 16th, 5:00 pm GMT from the Guardian live blog.

12. The Guardian’s live blog has good, up-to-date information on the status of the nuclear reactors at Fukushima.