Breeding Drug Resistant Bacteria at Farms

Modern commercial farming uses a lot of antibiotics, and, as a consequence, we’re beginning to see them breeding drug resistant bacteria (see here for exponential growth demo). Jeremy Laurance reports on one bug (MRSA ST398) now being found in milk.

Three classes of antibiotics rated as “critically important to human medicine” by the World Health Organisation – cephalosporins, fluoroquinolones and macrolides – have increased in use in the animal population by eightfold in the last decade.

The more antibiotics are used, the greater the likelihood that antibiotic-resistant bacteria, such as MRSA, will evolve.

The MRSA superbug can cause serious infections in humans which are difficult to treat, require stronger antibiotics, and take longer to resolve. Human cases of infection with the new strain have been found in Scotland and northern England

— Laurance (2012): New MRSA superbug strain found in UK milk supply in The Independent.

Note that consumers of milk don’t have to worry because the milk is pasteurized.

Natural Selection and Polar vs. Grizzly Bears

What I end up seeing, in this quintessentially 21st century creature, is a glimpse of the future.

— Gamble (2012): One, two, three, er…many. in The Last Word on Nothing.

The effect of rapid Arctic warming on polar bears has been a theme this year in Environmental Science, so this article on the hybridization of polar bears and grizzly bears caught my eye.

As caribou migration routes have moved North, grizzlies have followed and started mating with polar bears. Not only have they produced hybrid young, but those young are fertile. Polar bears and grizzlies only diverged about 150,000 years ago and haven’t developed many genetic differences, despite quite dramatic visual dissimilarities. Second-generation hybrids have now been confirmed in the wild.

This article is also of note to my Middle School science class because we’ve talked about speciation — the divergent evolution of two populations into separate species — before when we looked at the phylogenetic tree and bison evolution in particular. This seems to be a re-convergence after separation. As the climate warms the grizzly bears are able to range further north, while the polar bears are more restricted to the shores by the melted sea ice, so the two populations encounter each other more and more. Thus polar bears, may eventually disappear as they are re-incorporated into the grizzly population.

The author, Jessa Gamble, thinks this is a glimpse of things to come.

The Dish.

Assessment with the Toilet Paper Timeline of Earth History

With a larger class, and quite a bit of space in the gym, I had more flexibility working on the toilet paper timeline compared to the last time.

Labeling the timeline in the gym.

I built in a friendly race to see which group could find a set of events first, and allowed me to highlight nine different, important, series of events along the timeline.

The adapted spreadsheet, racing sequences, and a short summative quiz are on this Toilet Paper Timeline spreadsheet.

I broke the class up into 4 groups of 4, and each group created their own timeline based on a handout.

Groups of students lay out their toilet paper timelines. Post-it notes were used to label the events.

Then, I gave each group a slip of paper with four events on it (one event per student), and they had to race to see which group would be first to get one person to each event on the list. Once each group got themselves sorted out, I took a few minutes to talk about why the events were important and how they were related.

Table 1: The series of events.

1) We’ll be talking about plate tectonics soon, so it’s good for them to start thinking about the timing of the formation and breakup of the supercontinents.
Event 1 Event 2 Event 3 Event 4
Formation of Rodinia (supercontinent) Breakup of Rodina Formation of Pangea Breakup of Pangea
2) This sequence emphasizes the fact that most free oxygen in the atmosphere comes from ocean plants (plankton especially), and that a lot of free atmospheric oxygen was needed to to form the ozone layer which protected the Earth’s surface from uv radiation, which made the land much more amenable to life. Also, trees came way after first plants and oxygen in the atmosphere.
Event 1 Event 2 Event 3 Event 4
First life (stromatolites) Oxygen buildup in atmosphere First land plants First Trees
3) Pointing out that flowering plants came after trees.
Event 1 Event 2 Event 3 Event 4
First life First land plants First trees First flowering plants
4) The Cambrian explosion, where multicellular life really took off, happened pretty late in timeline. Longer after the first life and first single-celled animals.
Event 1 Event 2 Event 3 Event 4
First life (stromatolites) First animals First multicelled organisms Rise of multicelled organisms
5) Moving down the phylogenetic tree from mammals to humans shows the relationship between the tree and evolution over time.
Event 1 Event 2 Event 3 Event 4
First mammals First Primates Homo erectus Homo sapiens
6) More tectonic events we’ll be talking about later.
Event 1 Event 2 Event 3 Event 4
Opening of the Atlantic Ocean Linking of North and South America India collides with Asia Opening of the Red Sea
7) Pointing out that life on land probably needed the magnetic field to protect from the solar wind (in addition to the ozone layer).
Event 1 Event 2 Event 3 Event 4
Formation of the Earth First life Formation of the Magnetic Field First land plants
8) Fish came before insect. This one seemed to stick in students’ minds.
Event 1 Event 2 Event 3 Event 4
First Fish First Insects First Dinosaurs First Mammals
9) Mammals came before the dinosaurs went extinct. This allowed a discussion of theories of why the dinosaurs went extinct (disease, asteroid, mammals eating the eggs, volcanic eruption in Deccan) and how paleontologists might test the theories.
Event 1 Event 2 Event 3 Event 4
First Dinosaurs First Mammals Dinosaur Extinction First Primates

The whole exercise took a few hours but I think it worked out very well. The following day I gave the quiz, posted in the excel file, where they had to figure out which of two events came first, and the students did a decent job at that as well.

Why Diversity is Important

Diversity has been a recurring theme this semester. It started with the diversity conference our middle schoolers attended earlier this year, which, unfortunately, I’m not sure they got a lot out of. As a result, I’ve been making a little bit of a point to bring up the subject when it intersects with our work. This week were were talking about evolution and natural selection, as was able to talk about the practical advantages of both genetic and social diversity.

When the environment changes, species don’t usually have time to adapt. Instead, individuals who already have the genes for beneficial existing traits — traits that work well under the new conditions, like the ability to survive warming climates — will tend to breed more, and over the generations, more and more of the population will have the advantageous trait.

Therefore, to ensure the continuation of the species, we’ll want to have the maximum amount of genetic diversity.

Then I tacked. I asked if anyone was not interested in seeing the continuity of humanity, and the usual wags piped up to say that they could take homo sapiens or leave it. So I showed them the Voluntary Human Extinction Movement website. VHEMT advocates that people voluntarily stop having kids so that humanity eventually will become extinct, restoring the Earth’s environment to a healthy state. Their motto is, “May we live long and die out.”

The class was pretty uniformly aghast.

I particularly like the VHEMT website because it’s really hard to tell if they’re serious or not; which drove my students a little bit crazy. And I eventually got the key question I was angling for, “How could anyone want humans to go extinct?”

My response was, for them at least, quite unsatisfactory, because I chose to answer with a different question: “Do you think that diversity of thought is good?”

For some, their answer was no. However, I then reminded them of that first amendment to the U.S. constitution has to do with freedom of expression, which does seem to suggest that the founders thought diversity of ideas was a good thing. Just like species, countries with greater diversity of ideas are more likely to be able to adapt to changing conditions and succeed.

The application of evolutionary theory to social situations has, historically, been fraught with abuse (see the eugenics movement in particular). I also did not have time to bring the conversation back to why we might want to protect biodiversity. However, this particular lesson gets the point across that diversity has some important practical benefits that might not always be obvious.

Notes

An interview with VHMET on the Discovery Channel:

Semi-artificial Selection?

Just like drug resistant germs (we’ve discussed earlier), the rats are evolving.

“They’ve also mutated genetically and are bred to be immune to standard poisons.

“We have had to start using different methods such as trapping and gassing, which can be less effective and more costly.”

–Graham Chappell, from Rapid Pest Control in Newbury in Rowley (2012): Home counties demand stronger poison to deal with mutant ‘super rats’ in The Telegraph.

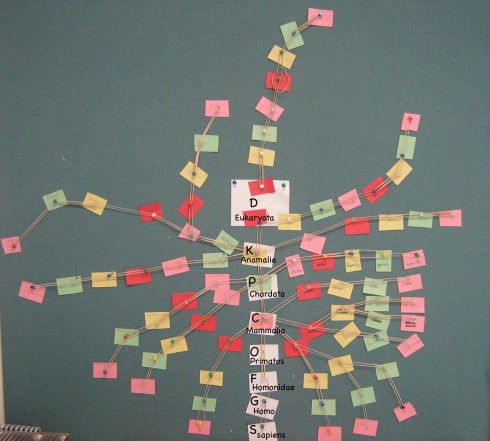
Building a Tree of Life (version 2)

Phylogenetic tree of randomly selected organisms.

I so liked how the tree of life turned out the last time I tried it, that I did it again this year with a significant improvement in the use of rubber bands.

Students chose organisms and then looked up their classification — Wikipedia quite reliable for this — then they wrote the names down on synchronized chips of colored paper. As usual, they preferentially chose charismatic, mammalian, megafauna, but there was also a squid, and for two people who did not come up with anything themselves, I assigned a plant (elm), and a bacteria (the one that causes strep throat).

The actual color pattern of the chips does not matter, but I used red for Domain, yellow for Kingdom, green for Phylum, pink for Class, red for Order, yellow for Family, green for Genus, and pink for species. The colors repeated, and I liked how that helped organize the pattern of the final result.

In class, using a pin-board, I used push pins to place homo sapiens on the board. I linked the push pins with rubber bands, which makes for a nicer, sharper pattern than using string, and is easier to do.

To get a nice pattern I then asked who had the closest relative to humans. It took a little effort to figure it out, but I decided to go with a degrees-of-separation metric. Basically, I asked them to count up the classification system to see how many levels they’d have to go to get to something their species shared with humans. The closest were at the Class level: mammals.

Then, starting with the students with the lowest separation distance, I had the students come up to the board and add their organism to the growing tree.

Later, during lunch, a student asked me what was the difference between bison and buffalo. I didn’t know, but another teacher pointed out that one was from North America and the other from Africa. So I asked two of my middle schoolers to look up the classification of american bison and water-buffalos, which we subsequently added to the tree, and which got me thinking about how we might use the rate of separation of the two continents to figure out how fast genetic variation develops.

Exponential Growth of Cells

Today I grew, and then killed off, a bunch of bacteria using the VAMP exponential growth model to talk about exponential and logarithmic functions in pre-Calculus. I also took the opportunity to use an exponential decay model to talk about the development of drug resistance in bacteria.

Two cells are reproducing (yellow) during a run of the exponential growth model.

Students had already worked on, and presented to each other, a few bacterial growth problems but the sound and the animation helped give a better conceptual understanding of what was going on.

After watching and listening to the simulation I asked, “What happens to the doubling time?” and one student answered, “It gets shorter,” which seems reasonable but is incorrect. I was able to explain that the doubling time stays the same even though the rate of reproduction (the number of new cells per second) increases rapidly.

Graph showing how the number of cells increases over time.
Switching from growth to decay (half-life of 50 sec).

Then I changed the model from growth to decay by changing the doubling time to a half-life. Essentially this changes the coefficient in the exponent of the growth equation from positive to negative. The growth rate’s doubling time was 100 seconds, but I used a half life of 50 seconds for decay to accelerate things a bit, but still show the persistence of the last of the bugs.

Exponential decrease in cell population/biomass.

The cells died really fast in the beginning, and while there was just one cell was left at the very end, it was pretty clear just how persistent that last cell was; cells were dieing so slowly at the end.

This is similar to what happens when someone takes antibiotics. The typical course lasts for 10 days, but you’ve killed enough of the bacteria to loose the symptoms of sickness after two or three. Those final few that remain are the most resistant to the antibiotic, and if you don’t kill them then, once you stop taking the antibiotic, they’ll start to grow and replicate and you’ll end up sick again with a new, antibiotic-resistant population of bacteria.

I thought that using the VAMP model for the demonstration worked very well. The sound of the cells popping up faster and faster with exponential growth seemed to help amplify the visual effect, and make the whole thing more real. And during the decay phase, having that last cell hang on, seemingly forever, really helped convey the idea that bacteria can be extremely persistent.

Buffalo vs. Bisons: Using their Phylogenetic Classification to Estimate the Rate of Evolution

Classification of american bison and water buffalos.

American bison (Bison bison) are native to North America, while water buffalo (Bubalus bubalis) are from Africa. They are different species, and each are classified in a different genus, however, they belong to the same Family, Bovidae. Since it’s highly unlikely that there was any genetic intermingling after Africa separated from North America, if we can figure out how long ago the two continents were together, we can estimate how long ago their common ancestor lived, and how fast evolution occurs (at least in large mammals).

Continental Rifting

North America is moving away from Africa at an average spreading rate of about 2.5 cm/year, and the continents are about 4550 km apart.

To figure out how long it has been since the continents were together, we need to convert the distance into the same units as the spreading rate and then divide by the rate.

Converting the distance to cm:
 \frac{4550 \text{km}}{1} \times \frac{1000\text{m}}{1\text{km}} \times  \frac{100\text{cm}}{1\text{m}}   = 455,000,000 \text{cm}

Finding the time:
 \frac{455,000,000 \text{cm}}{2.5 \text{cm/year}}= 182,000,000 \;\text{years}

So we get 182 million years.

Evolutionary Rates

Now to get really back-of-the-envelope. If it takes 182 million years to be separated by two levels of classification (the genus and species levels), then it takes approximately 91 million years for each level of classification.

If we extend this backwards up the phylogenetic tree (species –> Genus –> Family –> Order –> Class –> Phylum –> Kingdom ), which is probably illegal, we get a grand total of six levels of classification back to the divergence of the plant and animal kingdoms. That’s 546 million years, which is remarkably close to the time of the first fossil records of complex multi-cellular life, somewhere near the beginning of the Cambrian about 540 million years ago.

The major caveat, however, is that the first phylogenetic step, from Domain to Kingdom took a lot longer than our 91 million year average, since the first life appeared on Earth about 4 billion years ago.

Conclusion

There are lots of issues with this analysis, but the result is curiously coincidental. I’d really appreciate any thoughts on the validity of this particular exercise.

Note:

The spreading happens at the Mid-Atlantic Ridge, which bifurcates the Atlantic. However, if you look at a map of the bathymetry of the North Atlantic, you can see long striations — lines — that show the direction of the tectonic plate motion. The distance the continents moved are best measured along this line.