Dealing with test anxiety

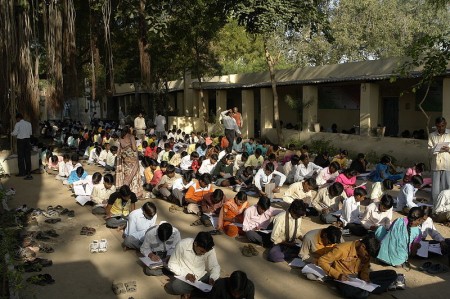
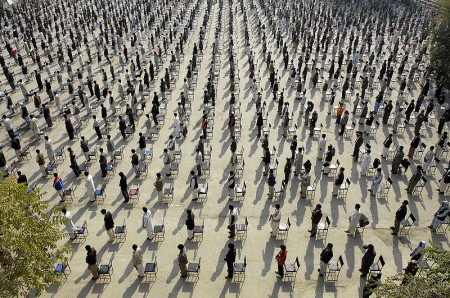
Afghan college entrance exam day. From Wikimedia Commons.

In the middle school our students have to take tests. While it’s not quite as bad as the Afghan college entrance exam, there’s the annual standardized test, and then there are the cycle tests every six weeks. Even with the cycle tests, some students have test anxiety. They see a math test with almost identical questions to the ones they have been doing perfectly for weeks and they freeze. I asked Ms. P. to look into strategies for dealing with test anxiety, and as usual, she came up with an excellent list of links.

Her favorite, which I also like, is Penn State’s University Learning Center’s Test Taking and Test Anxiety website. They, however, appear to have gone missing, but Effective Study’s How To Overcome Test Anxiety seems a good alternative. TeensHealth’s page is also good and aimed at a younger audience, although there is not much difference in the level of the writing for a middle schooler. If you need a clear list of things to do before and during the test, Study Guides and Strategies has an excellent page.

These sites tend to recommend preparing well and using relaxation techniques, such as deep breathing, during the test.

Other resources:

Exams in Jaura, India (from Wikimedia Commons)

Peace project gets into the news

Map of Uganda (from Wikipedia)

The Examiner, last week, had an article on a Montessori Peace Project in Uganda. US support is run by Carolyn Kambich for the Victoria Montessori School in Entebbe. A few of our students, who are fundraising for the project as a part of their cycle project, got a mention in the article by Ms. Kambich.

Mercenaries on the playing field

These, in the day when heaven was falling,
The hour when earth’s foundations fled,
Followed their mercenary calling,
And took their wages, and are dead.

Their shoulders held the sky suspended;
They stood, and earth’s foundations stay;
What God abandoned, these defended,
And saved the sum of things for pay.

– A.E. Housman

Three themes converged on the playing field today; poetry, competitive sports and video war games. We’d used Alfred Houseman’s “Epitaph on an Army of Mercenaries” for a lesson on OULIPO yesterday because it’s short and one of my small groups had presented a week ago so we were all familiar with the poem. We’d been trying post-games discussions after frizbee (and soccer) to learn sportsmanship. We’d been having issues with video games and the definition of the word “duty“. I’ve long suspected (and would love to find a study that looks into this) that video game players are more likely to give up when the odds are against them because they are so used to just restarting the game (or respawning).

Today at the end of our post game discussion, I recited Epitaph to highlight the strength of character shown by some of the players who put up a great comeback despite part of their team stopping playing. It was a serendipitous convergence of three themes we’ve been dealing with this entire cycle (if not the whole year). It was a moment when I really appreciated being able to be so engaged with all parts of the curriculum.

Effect of racial and gender discrimination today

Wealth and race in the U.S.. From Chang (2010).

The legacy of racial and gender discrimination persists (like segregated proms in Mississippi). Attitudes are, slowly changing over the course of generations, but it’s a really slow change. Even today, men make more than women for doing the same jobs. Mariko Chang’s recent paper on the wealth gap between black women and everyone else, has some fascinating statistics and graphs showing the current disparities in income (how much money people make) and wealth (how much stuff they have (assets minus their debts)).

An interesting question for students to consider after looking at the graph is why exactly are there these disparities. This may also be a good focus for a Socratic Dialogue.

Federal Reserve’s economic data

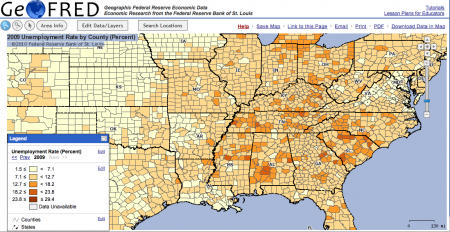
The St. Louis Federal Reserve has a Summer School program for teachers. Two of the sessions deal with current events (banking crisis and jobs) but the third covers the data and primary source documents that bank makes available online (for free). These include the FRED and GeoFred websites.

Unemployment data for the Eastern US from GeoFRED.

GeoFred produces graphs like the one above showing economic statistics across the country. It can do it on a state by state basis, by county (as above), or by even more refined areas.

US GDP from FRED.

FRED plots graphs and even provides the data for economic statistics over time. The graph above shows GDP since they started collecting data in the 1940’s. It also has the times of recessions shaded in. The data in the graph can also be downloaded if you want to do your own analysis.

These seem to be handy little tools for teaching and for research projects, and are pretty easy to use.

The teachers’ training sessions are free though you have to get your own housing. They do provide breakfast and lunch. If you want graduate credit for them however, each three day session will cost around $306 and garner one credit.

Segregated proms in 2009!

Image adapted from the Library of Congress.

Schools in the southern U.S. may have been desegregated forty years ago, but in many places there are still separate high school proms for black and white students. According to Sara Corbett in a New York Times article, it’s driven primarily by the parents rather than by the kids themselves.

“It’s awkward,” acknowledges JonPaul Edge, a senior who is white. “I have as many black friends as I do white friends. We do everything else together. We hang out. We play sports together. We go to class together. I don’t think anybody at our school is racist.” Trying to explain the continued existence of segregated proms, Edge falls back on the same reasoning offered by a number of white students and their parents. “It’s how it’s always been,” he says. “It’s just a tradition.” – Corbett (2009)

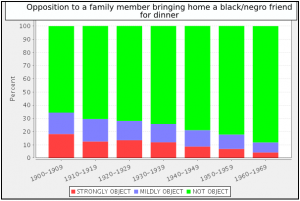
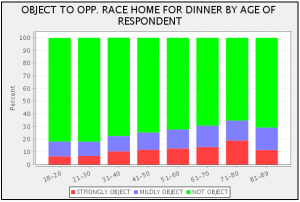
A quick run through the Survey Documentation and Analysis website produced this interesting graph that shows one aspect of the slow, generational change in racial attitudes.

Answers to the question, "How strongly would you object if a member of your family wanted to bring a (negro/black) friend home to dinner?". The x-axis shows the year the respondent was born.

Sportsmanship

“Winning is the easy part, losing is really tough. But, you learn more from one loss than you do from a million wins. You learn a lot about sportsmanship. I mean, it’s really tough to shake the hand of someone who just beat you, and it’s even harder to do it with a smile. If you can learn to do this and push through that pain, you will remember what that moment is like the next time you win and have a better sense of how those competitors around you feel. This experience will teach you a lot on and off the field!” – Amy Van Dyken

Sports bring out the best and the worst in us. In victory and defeat. When the competitive fires burn fiercest they strip away facade and open windows into the soul. We’ve been playing Ultimate Frisbee on and off all year for PE and like it because it offers, in a microcosm, a remarkable view into the character of my students. Subtle behaviors in the classroom get magnified on the playing field; the willingness to quit when the score is against you versus the quiet perseverance no matter what happens. Yet, if the way we act when we play sports reflects the our character, then perhaps we can shape our character by changing the way we act when we play. That’s what “they” mean when they say that playing sports builds character.

“How a man plays the game shows something of his character; how he loses shows it all.”
-Tribune (Camden County, GA)

I’ve also come to realize that team sports can work as a substitute for co-operative games if I insist on a half-time team talk and a post game discussion by the whole group. The half-time talks are turning into pep talks and the post-game talks are proving very useful. I choose someone at random to give the talk.

There are times when you’re tired and times when you don’t believe in yourself. That’s when you have to stick it out and draw on the confidence that you have deep down beneath all the doubts and worries.” -Jim Abbot

I have not had many post-match group talks, but I am rectifying that. After each game, the group need to address some reflective questions:

  • What worked?
  • What was challenging?
  • How did you feel?
  • What did you learn?

Once again, we practice reflective thinking, although this time it’s for the group as well as the individual. We’re building abstract thinking skills as well a character, and hopefully, they both reinforce each other.

“The answers to these questions will determine your success or failure. 1) Can people trust me to do what’s right? 2) Am I committed to doing my best? 3) Do I care about other people and show it? If the answers to these questions are yes, there is no way you can fail.” –Lou Holtz

The SDA

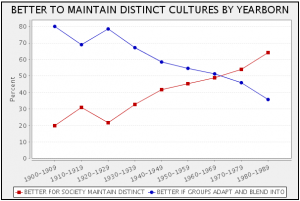
Answers to the question 'Some people say that it is better for a country if different racial and ethnic groups maintain their distinct customs and traditions. Others say that it is better if these groups adapt and blend into the larger society. Which of these views comes closer to your own?' sorted by year in which the respondent was born.

UC Berkley’s Survey Documentation and Analysis (SDA) website has a lot of potential as a research tool for the more advanced middle-schooler. I greatly encourage students to do original research in their semester-long Independent Research Projects. They pose questions, collect and/or analyze data and slog through the challenges of dealing with open ended questions. Middle school is the appropriate time for this as they are working on their formal thinking skills. With the increasing availability of websites like the SDA, everyone can gain access to research grade datasets.

The SDA is powerful because it has a lot of data from survey questions dealing with a large number of survey issues, from race relations, to perceptions of the economy, to use of the web. But with that power is a certain degree of complexity. It took me a while this morning to decipher the web interface and I’m no where near plumbing all the nuances of the statistical analysis, but it’s not too hard to do some basic plots.

Right side of the SDA webpage.

On the left side of the window is a list of all the survey questions available. There are a lot but they each have the full question so it’s pretty easy to figure out what they mean. When you select one, such as the opposition to a family member bringing home a black/negro friend for dinner, it gives you the little code, “RACDIN” in this case that you enter as the Row on the right side of the window (see the above figure). Now I want to know how people’s answers to that question changed based on how old they are, so for the Column option I put in “AGE”. Of course what I actually put in is “AGE(c:10,1)” which tells the program to lump all the age data into 10 year sets, starting at age 1.

Answer to the question, 'How strongly would you object if a member of your family wanted to bring a (negro/black) friend home to dinner?' sorted by age of the respondent.

Students will certainly need help getting started, and I could add video instructions if anyone wants it.

Now comes the most interesting part, interpreting the graphs. I like the plot at the top of this post for this reason. It shows that the younger people are the more likely they are to think it’s better if racial and ethnic groups maintain their customs and traditions. Does this mean that younger people have more racist attitudes, trying to maintain separation, or does it mean that they are more accepting of different cultures?