Was Osama bin Laden being proactive?

Well I managed to step in it quite nicely today. Up to the knees and then I had to start bailing.

The lesson on being proactive versus being reactive had been going so well. Proactive people “make it happen”, while reactive people “get happened to”. Proactive people are “can do”, while reactive people are “can’t do”. Proactives are “change agents”, while reactives are “victims”. Etc, etc ….

The pattern you notice from the lesson is that proactive equals good, while reactive is bad.

He was probably proactive ...

So can you give some examples of proactive people and reactive people? Yes, yes, Osama bin Laden, reactive. … Well…. Um… no, maybe not, … not necessarily? He did, he was a change agent, he made it happen. And thinking about it now, I’d be willing to bet Hitler was pretty proactive too.

... but so was he.

So I started to bail, trying to convey the idea that being proactive was about personal empowerment, and just because the bad guys are proactive doesn’t mean it’s a bad thing. I hope I got that across. What I think I should have added, and I’ll have to remember to do so tomorrow, is that if the bad guys are proactive, it’s all the more reason for the rest of us to be proactive too.
Cells, cells, cells

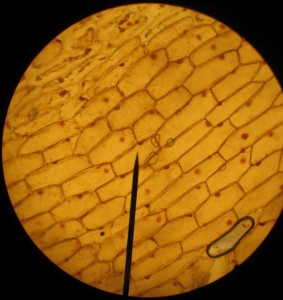
Onion cells stained with iodine. 100x magnification.

We spent the afternoon period on science. I’d given some individual microscopy lessons during the last immersion, where we looked at exciting protozoans moving around in pond water. This time they tried their hands at onion cells and staining with iodine, using a very nice and clear YouTube video posted below (kyliefansunited, 2008) as a reference.

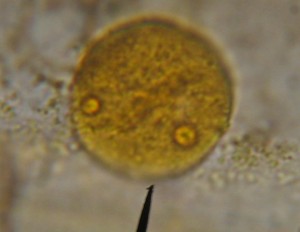
Nucleus of an onion cell stained with iodine and, for experimentation, Congo Red. 1000x magnification

The immersion oil had arrived in the mail earlier in the week so we got to try out the 100x oil lenses. We can now see structures inside the nucleus quite nicely.

Other things did not go so well. I’d written up, using the excellent recommendation of Anna Clarke, what I though was a neat exercise to look at the effect of osmosis on the cells of a waterplant, Egeria densa. The small group struggled with it, I think in large part because they were not quite prepared (had not done the background reading), and weren’t working very well together today. I’ll keep it on the schedule, but next time I’ll have to think hard on if it will be necessary to tweak the exercise.

Osmosis under the microscope

The effects of placing freshwater plant cells (Egeria densa) in salt water solution.

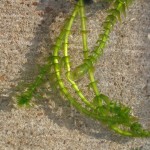
In a bit of a hurry, I swung by the pet store and picked up the aquatic water plant with the thinnest leaves I could find. It turned out to be Egeria densa, and while not the Elodea recommended by my expert contact Anna Clarke as a good subject for some microscope work, it seemed quite similar.

Egeria densa plants sitting in shallow water in the sun.

I needed the plant for an osmosis experiment. Dropping a little salt water on leaf cells of a freshwater plant should suck all the water out of the vacuoles and through the cell walls, potentially collapsing the cells (wouldn’t that be cool). I’d never done this before so I was quite curious to see what would actually happen.

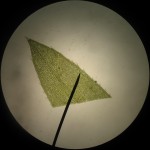
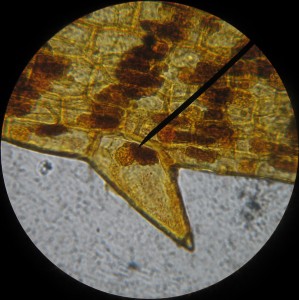
Leaf tip of Egeria densa. 40x magnification.

The leaves have multiple layers of cells, so it’s hard to distinguish much at the center of a freshly clipped leaf, especially at high magnification. But if you look at the cells at the edges of the leaves, you can see some really neat looking, spiky cells, for which, I’m willing to bet, biologists have some really cool, multisyllabic name.

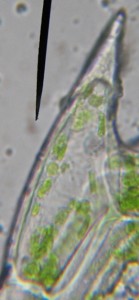
Spiky cell under 1000x magnification.

With a little bit of immersion oil and a 1000x objective, the spiky cells are good subjects for magnification: they’re a bit larger than their neighbors so they’re easier to see; their chloroplasts are distinct; and you can even make out the nucleus without staining.

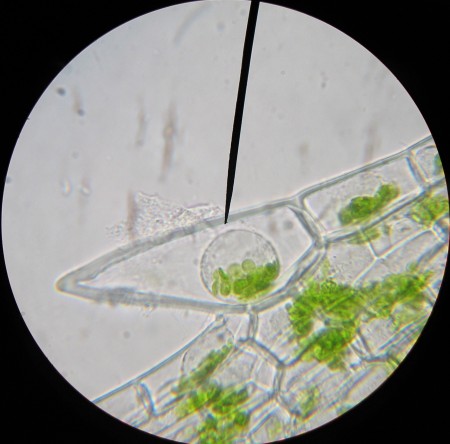
Then I added the salt solution, and while the cell walls stayed strong, the cytoplasm collapsed into a little droplet at the center of the cell. The chloroplasts and the nucleus were all bundled together in this central blob (see the image at the top of the post). It’s quite the neat effect, though not exactly what I thought to see.

Spiky Egeria cells with iodine stain.

An interesting side note is that the cell nuclei show up very nicely with iodine stain, but the stain also discolors the chloroplasts.

Oven calibration

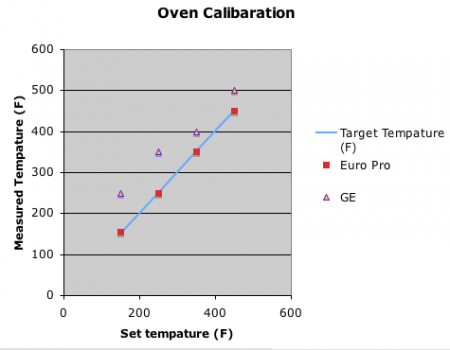
Initial oven calibration curves (2009).

Catastrophic failure of one of our ovens! Last year when we started up the bread business, we bought two counter-top ovens within a couple of weeks of each other. They needed to be extra-large to fit two loaves of bread each, which made them a little hard to find. We got a EuroPro oven first, and when we found that it worked pretty well, we went back to try to get another. But just a week later, the store was out of stock and that type of oven could not be found in the city of Memphis or its environs.

Instead we got a GE model. The price was about the same, as was the capacity. We quickly realized that the GE was quite the inferior product. The temperature in the oven was never the same as what was set on the dial. Our bread supervisor at the time ran a calibration experiment, the results of which you can see above, so we still managed to use the oven. Only this year, three weeks into the term, it conked out.

We sold at least one underdone loaf before we realized what had happened, and received a detailed letter in response (which our current bread supervisor handled wonderfully in his own well worded letter). Fortunately, we have found a newer version of our EuroPro oven, which seems to work quite well.

I like the oven calibration exercise. It was a nice application of the scientific process to solve an actual problem we had with the business. Though I know it’s not quite the same, I like the idea of doing annual oven calibrations just to check the health of our equipment and help students realize that the scientific process is a powerful way of looking at the world, not just something you do in science.

Financial reports and statistics

Sally, our school’s business manager, was kind enough to come in last month to help the financial department of the student run business organize its books. It was long overdue. We’d been improving our record keeping over the last couple years, but now we have much more detailed records of our income and expenses.

This is great for a number of reasons, the first of which is that students get some good experience working with spreadsheets. We use Excel, which in my opinion is far and away Microsoft’s best product (I’ve been using OpenOffice predominantly for the last year or so because, it improved quite a bit recently, and I’m a glutton for certain kinds of punishment.) I’ve been surprised by how many students get into college unable to do basic tables and charts, but hopefully this is changing.

The second reason is that the Finance committee can now use the data to give regular reports; income, expenses, profit, loss, all on a weekly basis. I expect the Bread division to benefit the most, since it has regular income and expenses, offering students frequent feedback on their progress. We’re now collecting a long-term, time-series data-set that will be very nice when we get to working on statistics in math later on.

In fact, we should be able to use this data to make simple financial projections. Linear projections of how much money we’ll have for our end-of-year trip will tie into algebra quite nicely, and, if we’re feeling ambitious, we can also get into linear regressions and the wave-like properties of the time series of data.

Standards, scope and sequence

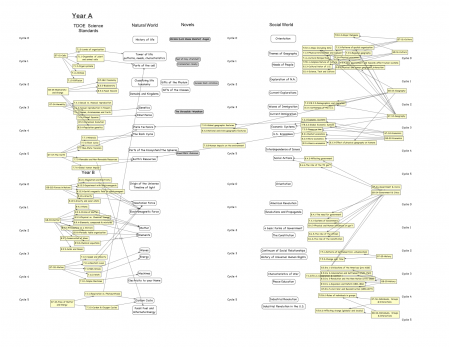
Curriculum alignment graphic. Still very much a work in progress.

The Montessori middle school curriculum we use is designed to meet the Texas state standards, so there are some interesting lessons about Texas history that I’ve had to drop or adapt, and some other topics that needed to be supplemented or replaced. Trying to represent this all in the same place has been quite the challenge. I’ve been working on the graphic above for some time.

The graphic is set up with the Tennessee Department of Education’s standards in mind, but I’m using the free, mind-mapping software, VUE, to make it easily adaptable. This way I can update any small annual changes fairly fluidly, and plug in the national standards when I get around to it. Aligning all the standards can be a bit of a pain, because the graphic really should be broken down to show the individual assignments that meet specific standards, but the figure is busy enough as it is.

In case it might be useful to anyone else, and so I can keep track of it myself, in addition to the image above I’m also posting a pdf version as well as Full-overview.vue here, with the strong caveat that it is very much a work in progress.

Jobs market update

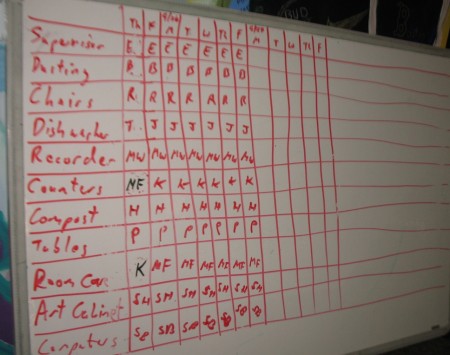
Classroom jobs market trading board.

I pitched the jobs trading idea to the class today over lunch. Ever since our first immersion, when couldn’t figure out how to sit down together for dinner, I’ve been working on getting them to think of mealtimes as a time for community building. Yesterday and today we had group discussions while we ate, which actually worked quite well for having a civil conversation.

I set up the basic jobs table for the next two weeks and established that the jobs supervisor would be the only person with the ability to authorize trades. We’re using the whiteboard above, which I like because it’s a bit like the Iraqi stock exchange right after the invasion.

My biggest concern was about how students would try to game the system. Fortunately, before I could even finish my pitch one student offered another a dollar to do their job for them, so I could go into great, loving detail that the rule is that the only commodity that can be traded are the jobs.

So we’ll see what happens. The market had its first trade this afternoon, though it might have just been for the novelty of the thing. It did become apparent that we need to post the details of the classroom jobs somewhere since the students are not yet familiar with the intricacies of each job. I plan on keeping track of the market volume to see how things develop. It would probably be interesting to survey the students in about a month to see what they think about the market, and if it achieved its objectives of making the classroom cleanup more efficient and enjoyable.

More mitosis resources

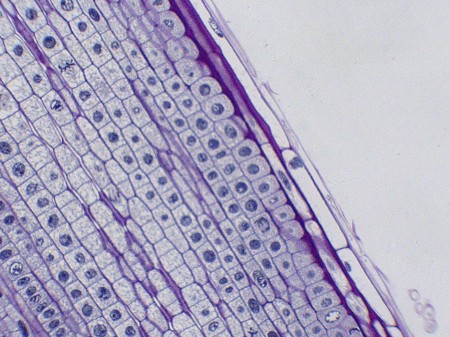
Onion root tip cells, with chromosomes stained to show cells in different stages of mitosis. Image from uafcde.

One of our small group activities is to look at mitosis in onion cells. Anna Clarke, recommended the University of Arizona site which has an Online Onion Root Tips activity for those without access to the slides or microscope. It also provides a good review even if you do have those resources. Dr. Paul’s page on onion cell division is a good supplement to the Arizona site because of its great cell images.

If you’re feeling ambitious and want students to make their own slides, you can try the SAPS page on Mitosis in root tips.