Middle school is where you learn the conventions of language: comma placement; who versus whom; and things like that. But language, and even its conventions, are ever evolving. Stephen Fry makes the case that we should be a little less pedantic.
Month: April 2011
Global Atmospheric Circulation and Biomes
We’re studying biomes and I don’t know a better way to consider how they’re distributed around the world than by talking about the global atmospheric circulation system. After all, the primary determinants of a biome are the precipitation and temperature of an area.
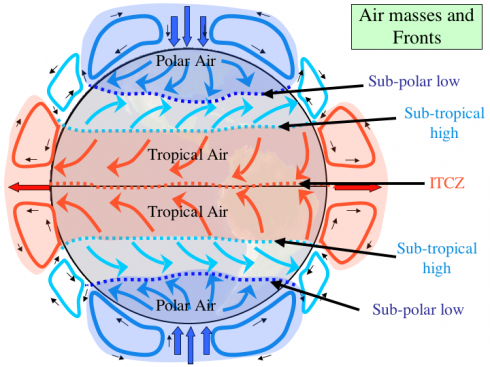
It’s a fairly complicated diagram, but it’s fairly easy to reproduce if you remember a few fairly simple rules: hot air rises; the equator is hotter than the poles; and the Earth rotates out from under the atmosphere.
Hot air rises
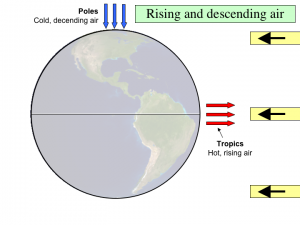
The equator receives more direct radiation from the Sun. A ray of light from the Sun hits the ground at an angle near the poles so it’s spread out more. More radiation at the equator means the ground (or ocean) is warmer, so it warms up the air, which rises.
The warm air can’t rise forever, gravity puts a stop to that. If we did not have gravity the atmosphere would float off into space (and the universe would be a fundamentally different place). Instead, when the air reaches the upper atmosphere at the equator it diverges, heading either north or south toward the poles.
From all around the hemisphere the air converges on the poles. The air is cooling as it moves away from the equator, and when it gets to the pole it sinks to ground level and then makes the journey back to the equator. It’s a cycle, aka a circulation cell.
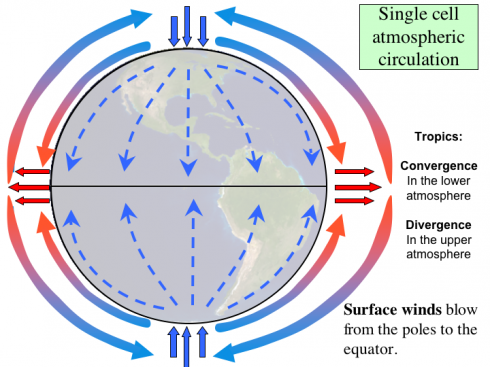
Standing on the ground, the wind would always be blowing towards the equator from the poles. If you were in the northern hemisphere, in say Memphis, you would always be getting northerly winds.
The ITCZ and the Polar High
At the equator the rising air also takes with it water vapor that was evaporated from the oceans or from the land (evaporation and transpiration, which are together called evapotranspiration). The warm air cools as it moves up in the atmosphere and the water vapor forms clouds.
You get a lot of clouds and rainfall anywhere there is a lot of rising air.
Because air is coming together, converging, from north and south at the equator, and the equator is in the middle of the tropics, the zone where you get all this rising air is called the Inter-Tropical Convergence Zone or ITCZ for short (that’s an acronym by the way). The ITCZ is pretty easy to identify from space.

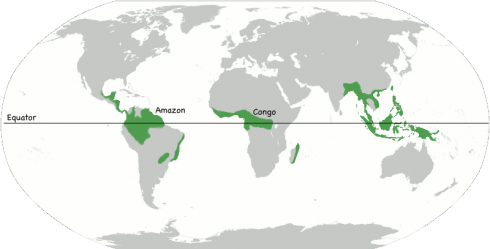
All the rain from the ITCZ, and the warmth of the equator means that when you go looking for tropical rain forests, like the Amazon and the Congo, you’ll find them near the equator.
Now at the pole, the air is sinking downward from the upper atmosphere. Sinking air tends to be very dry, and places with sinking air also tend to be dry (it’s not a coincidence). So although the poles are covered with ice, they actually tend to get very little snowfall. What little snow they get tends to accumulate over tens, hundreds and thousands of years but the poles are deserts, arctic deserts, but deserts all the same.
The region of sinking air near the poles is called the polar high because of the high pressure generated by all that descending air.
We’ll complicate the picture of atmospheric circulation now, but the ITCZ and the polar high don’t change.
The Earth Rotates
The complication is the coriolis effect. You see, as the Earth rotates it kind-of drags the atmosphere with it. After all, the atmosphere isn’t nailed down. It’s got it’s own motion and intertia, and doesn’t necessarily want to rotate with the Earth.

So a wind blowing from the North pole to the equator gets deflected to it’s right; the northerly wind becomes an easterly.
I could write an entire post about coriolis (and I will) but for now it shall suffice to say that the low-level wind from the pole gets deflected so much that it never reaches the equator. The high-level wind from the equator never reaches the pole, either. Instead of the one, single, circulation cell in each hemisphere, three develop, and you end up with the picture at the top of this post.

Note also that the winds in the region just north of the equator (where the label says “Tropical Air”, come from the northeast. These are the northeast trade winds that were vital to the transatlantic trade in the days of sailing ships. Know about them help a lot in the Triangular Trade game.
The Sub-Tropical High and the Sub-Polar Low
With three circulation cells you add the sub-tropical high, and the sub-polar low to the ITCZ and polar high as major features that affect the biomes.
Remember, rising air equals lots of rain, while descending air is dry.
So the sub-tropical high, with its descending air, makes for deserts. Since it’s in the sub-tropics these are hot deserts, the type you typically think about with sand-dunes, camels and dingos.
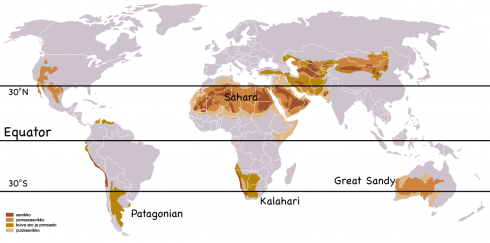
The USGS also has a great map that names the major deserts.
Biomes
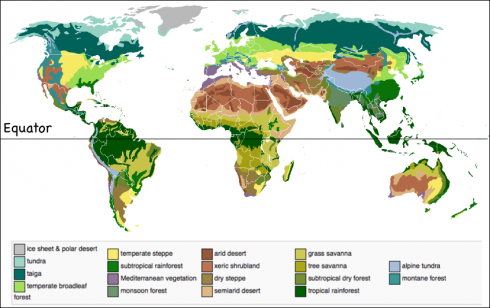
So if we now look at the map of biomes and climates from around the world we can see the pattern: tropical rainforests near the equator, deserts at 30 degrees north and south, temperate rainforests between 40 and 50 degrees latitude, and arctic deserts at the poles.
Power Down and Disconnected
Like addicts racing to get their overdue fix, my students raced to the computers this afternoon after having had to survive all day without power and without the internet. I’ll confess that I felt the same urge, but was able to restrain it. Until now.
We usually don’t have internet access during our immersions, but then it’s expected and students are not inside needing to refer to the study guides to figure out their assignments. At the beginning of the year I gave everyone paper copies of the study guides, but now there are just a core few who request them.
Fortunately, we had a couple of smart-phones so one student would look up the reading assignment and post the page numbers on the whiteboard. Fortunately, the reading assignments were out of the book.
We weren’t quite surviving without technology, but it was close, and students were getting innovative.
We’ve had storms every few days for the last couple of weeks, which is typical for Memphis at this time of year. Over the last few days a frontal system has just been pushing back and forth over us. When it pushes south we get a cold front with thunderstorms and rain, but clear skies afterward. When the front pushes north it gets warm and humid, and the sky goes overcast for most of the day.
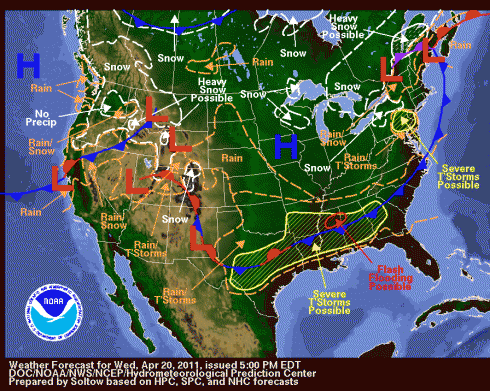
This line of fronts marks the general location of the sub-polar low, which is moving north with the spring. But more on that tomorrow.
Living in the Slums

Jonas Bendiksen has an amazing website of photos, sounds and stories from life in slums in South America, Africa and Asia. It’s quite a poignant. You get wide-angled photos from far away and then the photographer steps closer to his subjects until you’re in a panorama of someone’s small apartment, hearing their story.
This cycle we’re working on social action.
Bendiksen’s work ties in well with Mollison’s Where Children Sleep.

Why go to College? Not for the Money.
If learning is not for its own sake, it isn’t liberal learning. It’s a utilitarian calculus for material self-advancement. The important things are not worth knowing because they are useful. They are worth knowing because they are true. [my italics]
–Andrew Sullivan (2011): Education For Its Own Sake
This quote, feeds off a plea by Freddie DeBoer against our constantly putting things in terms of dollars, cents and economic value. It argues against much of the premise of behavioral economics (and much of environmental economics too), which tries to better understand human nature by translating everything into money.
The economists themselves will tell you that this remains just one part of the story, and the work brings us to a better understanding of how humans behave and what they really value, but, living in a very capitalist society, it’s easy to lose track.
Epic Rain-Garden
Talk about a long day! (“What an understatement,” she says.)

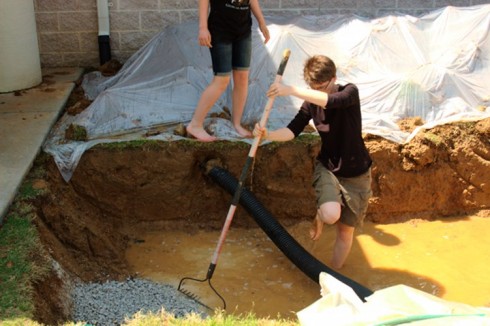
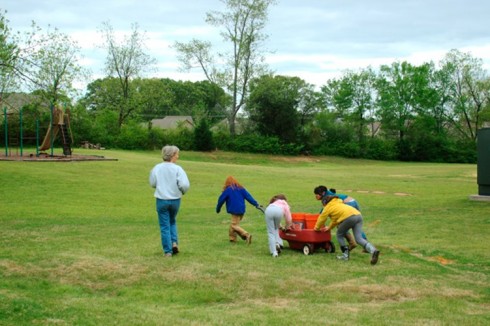
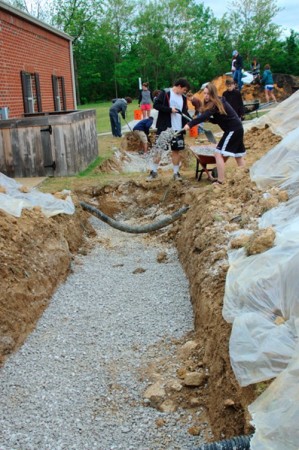
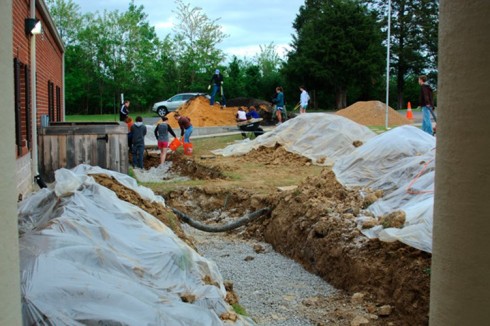
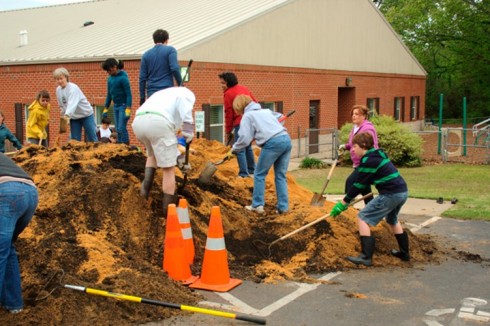
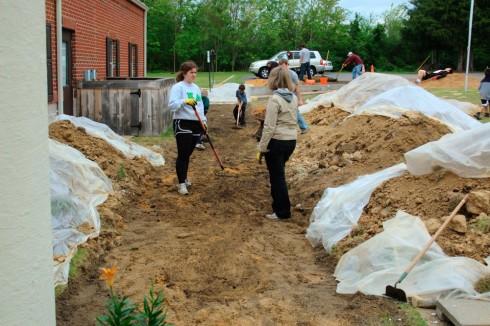
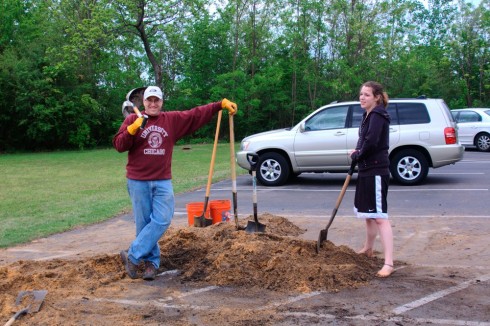
We moved about 45 tons of sand, gravel and compost today, filling in the moat we dug last week. We were lucky enough to have the help of a backhoe for the digging, but all the filling in today was done by hand, with shovels and wheelbarrows.

Despite rumors about it being a first line of defense against the Cordovan barbarian hordes, the moat was actually intended to become a rain garden, which was designed by the Rhodes College Hydrogeology class to intercept some of the runoff slope that funnels water directly down toward the school during the intense rainfall that we get with our spring and fall mid-latitude cyclones.
So we had to get rid of the heavy, dense, silty-loam soil that is really slow to let water seep through, and makes it hard to grow anything on the Memphis side of the Mississippi River. The fine grained silt was blown over from the Mississippi River floodplain about 20,000 years ago when the ice-age glaciers were melting and all their ground up rock flour was being washed down the Mississippi. This type of wind-blown sediment is called loess. I like the sound of the word because if you stretch out the “oe” properly it does something to the back of your throat that feels distinctly German; however, if you ask someone from the deep south to pronounce it, you’ll hear the name of Clark Kent’s girlfriend.

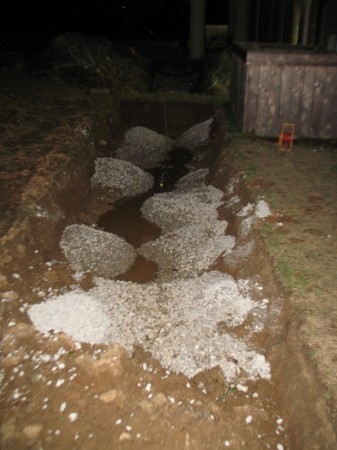
The backhoe dug two trenches, each about 2 m wide, 6 m long, and about 60 cm deep, and piled the soil up next to the holes. Moving this stuff is not trivial. My middle-school students gave it a try on Friday afternoon and though they made a small dent, there is an awful lot more to do (my students also helped figure out how long it would take to finish pumping out Friday morning’s collected rainwater from the trenches).
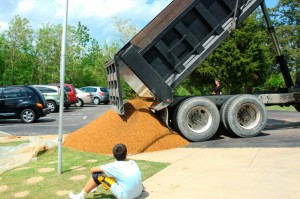
Then, on Saturday, with large piles of the old soil still sitting there, we replaced the impermeable loam with a fifty-fifty mix of sand and compost, underlain by five centimeters of pea-sized gravel on top of five centimeters of crushed limestone. This material was delivered by dump truck on Friday afternoon, while school was still in session. It was loud, exciting, and according to one member of the pre-school aged audience, “the best day ever!”

I have to agree. It was kind-of exciting. Although for me, the bright, brown pile of pea gravel evoked fond memories of pyramids of powdered curry, saffron and tummeric sitting on the spice-seller’s stall in a market in Morocco .
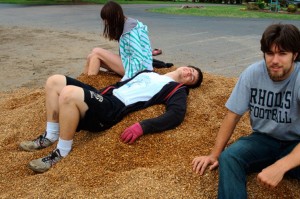
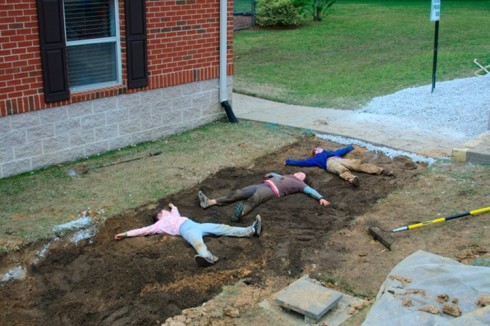
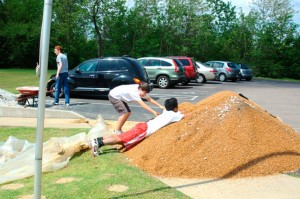
For others the pea gravel was a more tactile experience: snuggling into it, after a hard day’s work, appeared to be quite therapeutic.

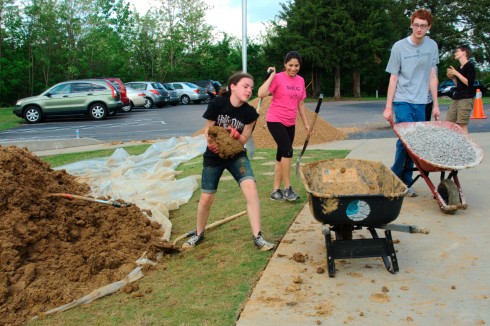


To be continued…
It’s 10 PM and the Moat is Empty
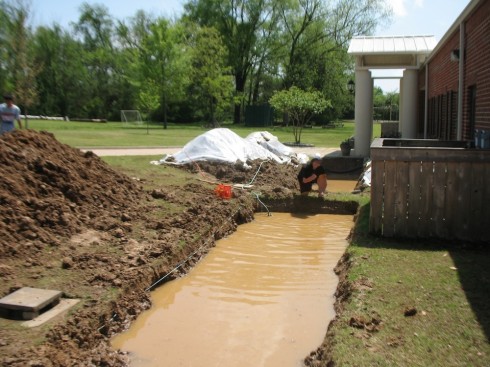
My students and I had a great chance to use the our recent geometry work when we figured out how long it would take to drain the new moat in front of the school.
It’s not really a moat, it’s going to be a flower bed that will soak up some of the runoff that tries to seep into the school’s doors every time a spring or fall thunderstorm sweeps through.
The hole was dug on Thursday evening and filled with rainwater with water, half a meter deep, by Friday morning’s rain. At least we know now that the new beds are in the right place to attract runoff.
But to fill the trenches with gravel, sand and soil, we needed to drain the water. With a small electrical pump it seemed like it would take forever; except that we could do the math.
The pump emptied water through a long hose that runs around the back of the building where the topography is lower. I sent two students with a pitcher and a timer (an iPod Touch actually) to get the flow rate.
They came back with a time of 18.9 seconds to fill 4 liters. I sent them back to take another measurement, and had them average the to numbers to get the more reliable value of 18.65 seconds.
Then one of the students got out the meter-stick and measured the depth of the moat at a few locations. The measurements ranged from 46 cm to about 36 cm and we guesstimated that we could model the moat as having two parts, both sloping. After measuring the length (~6 m) and width (2 m), we went inside to do the math.
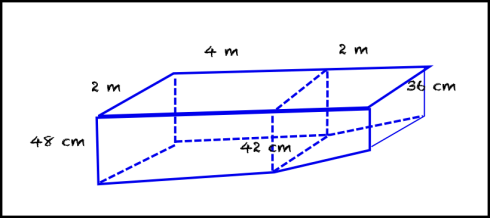
With the help of two of my students who tend to take the advanced math option every cycle, we calculated the volume of water (in cm3) and the flow rate of the pumped water (0.2145 cm3/s). Then we could work out the time it would take to drain the water, which turned out to be a pretty large number of seconds. We converted to minutes and then hours. The final result was about 7 hours, which would mean that the pump would need to run until 10 pm.
And it did.
Art and Science: Flow Paths

I’ve been helping my wife model the fluid flow through her apparatus, and she has some really neat results from some experiments where two chemicals react and block off the regular, symmetrical flow.
The streamlines look a bit like butterfly wings to me, so I modified the image a little. The original flow paths through the circular apparatus are below. I’m not sure which image I like better.

P.S. The other thing I learned from this little exercise is how to write Scalable Vector Graphics (svg) files (W3C has an excellent reference). With svg’s, like other vector graphics formats, no matter how big you blow them up you never loose resolution like you would do with a regular, rasterized image. Unfortunately, I still have to figure out how to include the svg files on this blog, so these png images will have to do for now.