Global Atmospheric Circulation and Biomes

We’re studying biomes and I don’t know a better way to consider how they’re distributed around the world than by talking about the global atmospheric circulation system. After all, the primary determinants of a biome are the precipitation and temperature of an area.
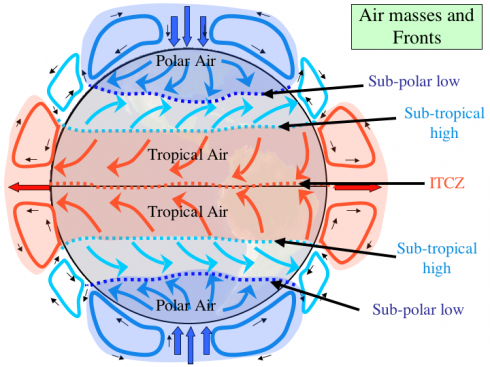
Diagram showing global atmospheric circulation patterns.

It’s a fairly complicated diagram, but it’s fairly easy to reproduce if you remember a few fairly simple rules: hot air rises; the equator is hotter than the poles; and the Earth rotates out from under the atmosphere.

Hot air rises
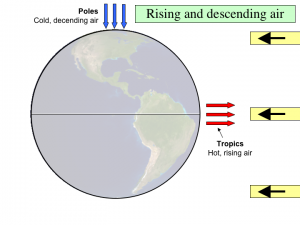
Light from the Sun hits the equator directly but hits the poles at a glancing angle, so the equator is warmer than the poles. Warm air at the equator rises while cold air at the poles sinks.

The equator receives more direct radiation from the Sun. A ray of light from the Sun hits the ground at an angle near the poles so it’s spread out more. More radiation at the equator means the ground (or ocean) is warmer, so it warms up the air, which rises.

The warm air can’t rise forever, gravity puts a stop to that. If we did not have gravity the atmosphere would float off into space (and the universe would be a fundamentally different place). Instead, when the air reaches the upper atmosphere at the equator it diverges, heading either north or south toward the poles.

From all around the hemisphere the air converges on the poles. The air is cooling as it moves away from the equator, and when it gets to the pole it sinks to ground level and then makes the journey back to the equator. It’s a cycle, aka a circulation cell.
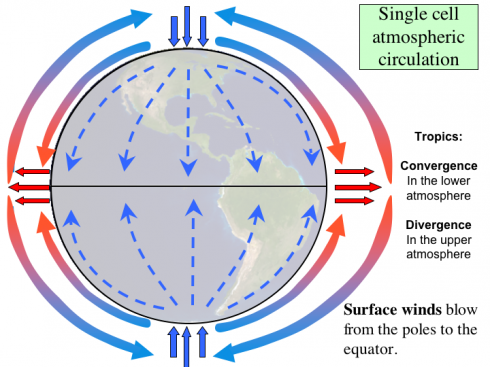
Hot air rising near the equator and sinking near the poles creates a cycle, a circulation cell, in each hemisphere. In this picture, the winds at ground level (dashed blue lines) would always be blowing from the poles toward the equator. This is what the world might be like without the coriolis effect.

Standing on the ground, the wind would always be blowing towards the equator from the poles. If you were in the northern hemisphere, in say Memphis, you would always be getting northerly winds.

The ITCZ and the Polar High

At the equator the rising air also takes with it water vapor that was evaporated from the oceans or from the land (evaporation and transpiration, which are together called evapotranspiration). The warm air cools as it moves up in the atmosphere and the water vapor forms clouds.

You get a lot of clouds and rainfall anywhere there is a lot of rising air.

Because air is coming together, converging, from north and south at the equator, and the equator is in the middle of the tropics, the zone where you get all this rising air is called the Inter-Tropical Convergence Zone or ITCZ for short (that’s an acronym by the way). The ITCZ is pretty easy to identify from space.
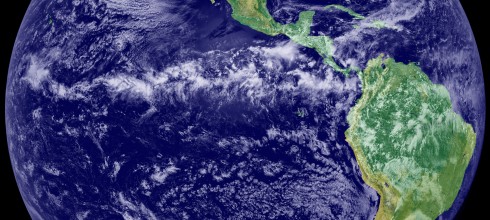
The line of clouds near the equator shows where air is converging at ground level and rising to create clouds. It's called the ITCZ. (Image via NOAA, which also hosts real-time images of the Tropical Atlantic that show the ITCZ very well).

All the rain from the ITCZ, and the warmth of the equator means that when you go looking for tropical rain forests, like the Amazon and the Congo, you’ll find them near the equator.
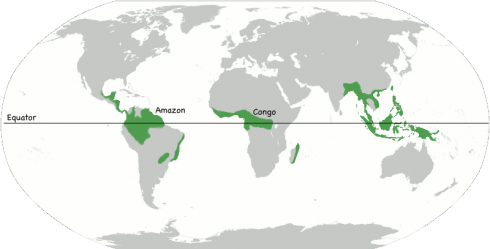
Locations of rainforests (more or less). Notice that in addition to the Congo and Amazon, Indonesia is pretty well forested too. All because of the ITCZ.

Now at the pole, the air is sinking downward from the upper atmosphere. Sinking air tends to be very dry, and places with sinking air also tend to be dry (it’s not a coincidence). So although the poles are covered with ice, they actually tend to get very little snowfall. What little snow they get tends to accumulate over tens, hundreds and thousands of years but the poles are deserts, arctic deserts, but deserts all the same.

The region of sinking air near the poles is called the polar high because of the high pressure generated by all that descending air.

We’ll complicate the picture of atmospheric circulation now, but the ITCZ and the polar high don’t change.

The Earth Rotates

The complication is the coriolis effect. You see, as the Earth rotates it kind-of drags the atmosphere with it. After all, the atmosphere isn’t nailed down. It’s got it’s own motion and intertia, and doesn’t necessarily want to rotate with the Earth.
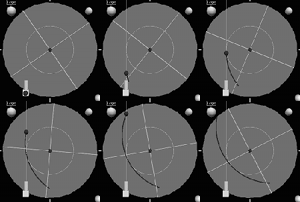
Deflection of the wind, represented by a ball, because of the movement of the Earth beneath it. The ball here moves in a straight line but it appears to curve because the Earth is rotating out from under it. Click the image for a bigger, better version.

So a wind blowing from the North pole to the equator gets deflected to it’s right; the northerly wind becomes an easterly.

I could write an entire post about coriolis (and I will) but for now it shall suffice to say that the low-level wind from the pole gets deflected so much that it never reaches the equator. The high-level wind from the equator never reaches the pole, either. Instead of the one, single, circulation cell in each hemisphere, three develop, and you end up with the picture at the top of this post.

In this diagram, the convention is that it shows the circulation cells along the side of the globe, in profile, while the arrows within the circle of the globe show the wind directions on surface.

Note also that the winds in the region just north of the equator (where the label says “Tropical Air”, come from the northeast. These are the northeast trade winds that were vital to the transatlantic trade in the days of sailing ships. Know about them help a lot in the Triangular Trade game.

The Sub-Tropical High and the Sub-Polar Low

With three circulation cells you add the sub-tropical high, and the sub-polar low to the ITCZ and polar high as major features that affect the biomes.

Remember, rising air equals lots of rain, while descending air is dry.

So the sub-tropical high, with its descending air, makes for deserts. Since it’s in the sub-tropics these are hot deserts, the type you typically think about with sand-dunes, camels and dingos.
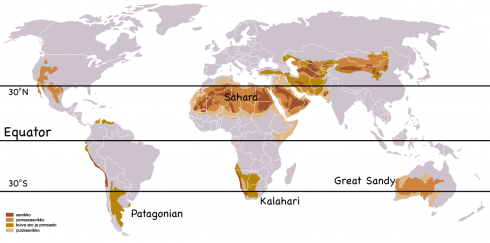
Sub-tropical deserts from around the world. They're located in the zones 30 degrees north and south of the equator at the sub-tropical high. Base map by Vzb83 via Wikimedia Commons.

The USGS also has a great map that names the major deserts.

Biomes

So if we now look at the map of biomes and climates from around the world we can see the pattern: tropical rainforests near the equator, deserts at 30 degrees north and south, temperate rainforests between 40 and 50 degrees latitude, and arctic deserts at the poles.
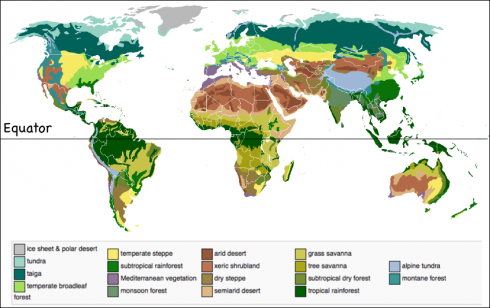
Map of biomes from around the world. The different biomes are closely related to the general atmospheric circulation model. (Image adapted from Sten Porse via Wikipedia)

The Montessori Method and Free Markets

If economics ultimately boils down to the study of human behavior, and our students are ultimately human (stick with me for a second here), then economic theory ought to be able to inform the way we teach. In fact, I’d argue that constructivist approaches to education, like Montessori, work for the same reasons that free-markets outperform highly-centralized command economies: freedom (within limits) better maximizes human welfare. I think this applies both to students in aggregate (the entire student population), and to the individual student also, though you probably have to aggregate over time.

What do I mean by Economics

As a study of human behavior economics differs from psychology, sociology and the other social sciences primarily because it uses money as a metric. This gives it a lot more data to play with. The last century has clearly demonstrated the advantages of the “invisible hand” of the free-market over highly-centralized command economies in providing for the broader public good. So what lessons from the study of economics can we apply to education?

To be clear, I’m not suggesting that we should be treating our schools and classrooms as businesses. We’re not trying to maximize profits for a firm (via test scores or however else that might translate to education), we’re trying to maximize the welfare of our students, which I take to mean, helping them achieve their full potential.

Command-and-Control

As we’ve seen in our studies of economics, flexible, market-based approaches are much better (more efficient) at achieving goals that the command-and-control, dictatorial model. The evolution of EPA’s approach to regulating pollution is an excellent example of how a federal agency learned to employ the experience of economics to better achieve a public good.

The Cayahoga River on fire in 1952. Image from United Press International via NOAA.

In the 1960’s and 70’s, rivers catching on fire, smog, and books on the invisible consequences of pollution, like Silent Spring, inspired the environmental movement and spurred the creation of the Environmental Protection Agency (EPA).

The EPA’s job was, and is, to enforce the laws that reduce pollution and protect environment. In the beginning, they did this by telling industry and companies what to do: the EPA mandated strict limits on the emissions from factories; and power plants were required to install the “best available technology” to reduce pollution. These approaches sound good, and are certainly necessary for pollutants that are dangerous to places close to where they are emitted, but they can be expensive, encouraging people to look for loopholes in the rules so they also become expensive to enforce.

You get the same problems with long, detailed lists of rules in the classroom. Students try to circumvent the letter of the law, rather than adhere to the spirit of the rules. “No iPods allowed,” is forced to evolve into “No Personal Electronic Devices.” Then come the questions, “What about watches?” and, “What about iPads?” so more rules need to be added to the list. By the end of the week you’re approaching a list of rules approaching the length of the tax code, and still adding more.

In the case of environmental regulation, to deal with this type of problem, the field of environmental economics emerged. Environmental economists try to figure out how to achieve the pollution reducing outcomes that everyone wants in the most economically efficient way possible. More efficiency means lower costs to society. They found that there are usually quite a number of ways to achieve the environmental objectives, using the principles of the free market, that are much more efficient than the command-and-control approach the EPA had been using.

Economists like to use mathematics. There are lots of supply and demand curves, and lots of derivatives, which tend to force some over-simplification (in much the same way that your textbook supply and demand curves are almost invariably straight lines). However, sometimes simple models can lead to a better understanding of how people in societies work.

Cap and Trade

Trees believed to have been killed by acid rain. Image via Wikimedia Commons.

In the 1980’s coal burning factories and power plants were churning out a lot of pollutants. One of these, sulphur dioxide (SO2) would react with rainwater and to create sulphuric acid, which would fall as acid rain. Acid rain was a huge problem because lots of plants and animals living in lakes, streams and forests were finding it hard to adapt to the increasing acidity of their environment. Furthermore, more acidic rainwater was damaging the paint on people’s cars and dissolving limestone statues and buildings.

So the EPA implemented a Cap and Trade program. They had a good idea of how much SO2 was being released into the atmosphere, and they know how much they wanted to reduce it by, so they started to issue companies permits to pollute.

The trick was that EPA would only give out permits equal to the total amount of SO2 emissions they wanted, and every year they would reduce the amount of permits until they reduced the pollution enough to resolve the acid rain problem.

Now all the companies that polluted SO2 had to either buy a permit or stop polluting. If they could easily reduce their pollution, a company might have extra permits that they could sell to a company that was having a harder time. In theory, some companies could even buy up permits from other companies and increase their pollution. But since the EPA was only giving out so many permits, whatever happened the total SO2 pollution was still going down.

Doing it this way let the EPA set the goals and let the market for pollution permits allocate how the actual pollution reduction got done. Since the permits could be sold, this encouraged the companies that could easiest reduce their pollution to do so, resulting in a reduction in pollution at the lowest cost.

It also meant that companies were now starting to pay for the environmental damage they were doing. Acid rain is a regional problem so it’s hard to say that your pollution from your factory in Ohio is specifically causing the acid rain here in my forest in Vermont. The atmosphere was being treated as a common dumping ground.

Cap and trade is not without its problems, however, at least in this case, it worked extremely well.

The Innate Desire to do the Dishes

Montessori believed that children have an innate desire to learn. We’ve seen how easily praise and rewards can damage that internal drive. I have, however, found it hard to identify my student’s innate desire to do the dishes. They may want a clean environment, they may have been trained since pre-kindergarten to clean up after themselves (restore their environment), but their is quite often a reluctance to doing it themselves.

Classroom jobs market.

The relationship to the pollution issue is startling to think about at first, but really the issues are the same. After struggling for quite a while to get everyone to do their classroom jobs, recognition of the parallel between my job and the EPA’s lead me to thinking about creating the Job Market Trading Board. Students can trade jobs and when they do it, but in the end, the jobs get done. I remain impressed at how well it has worked.

The basic principle is more general though: set the goals and let the students figure out the best way to accomplish them.

Nuclear Fallout: Chernobyl pictures

Just in time for us to start reading The Chrysalids, David Schindler has a frightening gallery from the abandoned surroundings of Chernobyl, twenty-five years after the accident with the nuclear reactor.

The YouTube video below shows the same images as the gallery.

Energy inefficiency: Checks and balances

The government’s Energy Star program to label products that are more energy efficient was in the news recently (and there are a lot of different products that have the label). The New York Times ran a story on how auditors, when asked by congress, submitted 20 fake and often ridiculous products to be approved for the stickers many environmentally aware people look for when they buy appliances like refrigerators (an AP report is also available).

GAO obtained Energy Star certifications for 15 bogus products, including a gas-powered alarm clock. – (GAO, 2010)

The Energy Star investigation was done by the Government Accountability Office (GAO), which is often tasked with checking up on the other branches of the government. The GAO website is a great information source because they post very readable summaries of their reports, and a highlights page that answers the question, “Why GAO Did This Study” and “What GAO Found”.

This Energy Star poster now takes a somewhat sinister (Orwellian) cast.

This study highlights the lesson that while we want to be environmentally aware, we must always remain skeptical of claims pushed by manufacturers, even if they are supported by government certification. It also highlights an excellent application of the concept of checks and balances. One branch of government (congress) checks up on others (EPA and DOE who run the Energy Star program are part of the executive branch) and the others are forced to improve.