Chasing Raindrops: A Hike in Natchez Trace State Park

In which we follow the path of a raindrop from the watershed’s divide to its estuary on the lake.
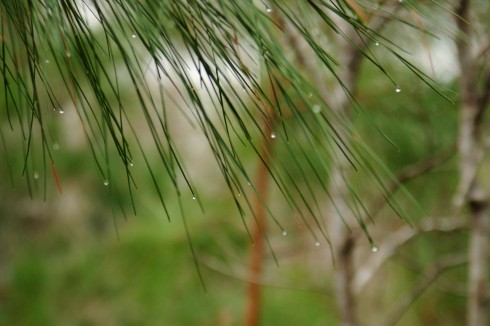
Droplets of water scintilate at the tips of pine needles. When they fall to the ground they continue their never-ending journey in the water cycle.

The most recent immersion. Coon Creek.

We stayed at Natchez Trace State Park and just a couple meters away from the villas is the head of the Oak Ridge Trail (detailed park map here).


View Natchez Trace Immersion Hike in a larger map

The first thing you notice is a small, rickety bridge whose main job is to keep your feet dry as you cross a very small stream. The stream is on its delta, so the ground is very soggy, and the channel is just about start its many bifurcations into distributaries that fan out and create the characteristic deltaic shape.

Delta and estuary of the small stream near the villas.

There’s a bright orange flocculate on the quieter parts of the stream bed. It’s the color of fresh rust, which leads me to suspect it’s some sort of iron precipitate.
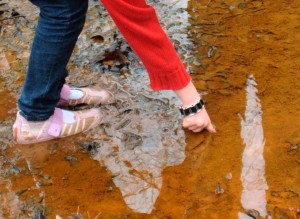
It is quite easy to stick your finger into the red precipitate at the bottom of the stream.

Iron minerals in the sediments and bedrock of the watershed are dissolved by groundwater, but when that water discharges into the stream it becomes oxygenated as air mixes in. The dissolved iron reacts with the oxygen to create the fine orange precipitate. Sometimes, the chemical reaction is abiotic, other times it’s aided by bacteria (Kadlec and Wallace, 2009).
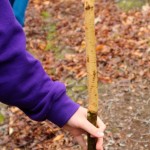
The bark has been chewed off the top half of this stick. The tooth marks are characteristic of beavers.

Past the small delta, the trail follows the lake as it curves around into another, much bigger estuary (see map above). We found much evidence of flora and fauna, including signs of beavers.

We even took the time to toss some sticks into the water to watch the waves. With a single stick, you can see the wave dissipate as it expands, much like I tried to model for the height of a tsunami. We also threw in multiple sticks to create interference patterns.
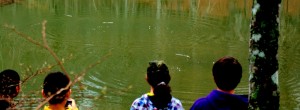
Observing interference patterns in waves.

The Oak Ridge Trail, which we followed, diverges from the somewhat longer Pin Oak Trail at the large estuary (which is marked on the map). The Pin Oak Trail takes you through some beautiful stands of conifers, offering the chance to talk about different ecological communities, but we did not have the time to see both trails.

Instead, we followed the Oak Ridge Trail up the ridge (through one small stand of pines) until it met the road. The road is on the other side of the watershed divide. I emphasized the concept by having my students stand in a line across the divide and point in the direction of that a drop of water, rolling across the ground, would flow.
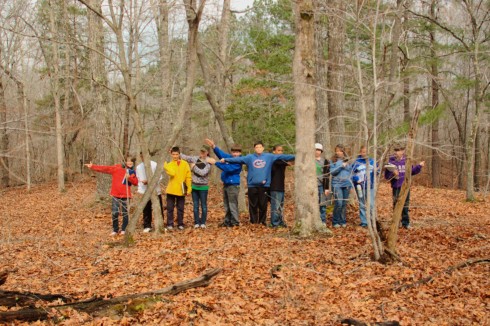
At the watershed divide.

Then I told them that we’d get back by following our fictitious water droplet off the ridge into the valley. And we did, traipsing through the leaf-carpeted woods.
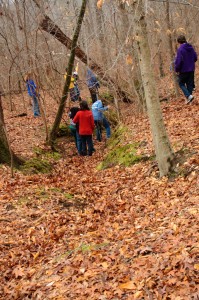
Students imitating water droplets find a dry gully.

Of course there were no water droplets flowing across the surface. Unless its actively raining, water tends to sink down into the soil and flow through the ground until it gets to the bottom of the valley, where it emerges as springs. Even before you see the first spring, though, you can see the gullies carved by overland flow during storms.
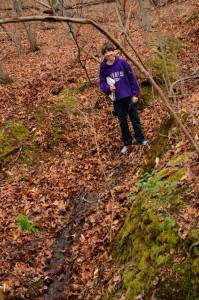
Spring.

Following the small stream was quite enjoyable. It was small enough to jump across, and there were some places where the stream had bored short sections of tunnels beneath its bed.
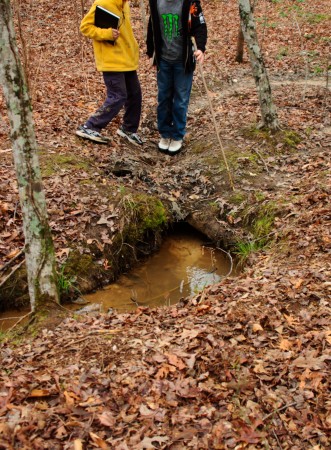
The stream pipes beneath its bed. Jumping up and down over the pipe caused sediment to be expelled at the mouth of the tunnel.

I took the time to observe the beautiful moss that maintained the banks of the stream. Students took the time to observe the environment.

Taking a break at the confluence of two streams.

Downstream the valley got wider and wider, and the stream cut deeper and deeper into the valley floor, but even the small stream sought to meander back and forth, creating beautiful little point bars and cut-banks.
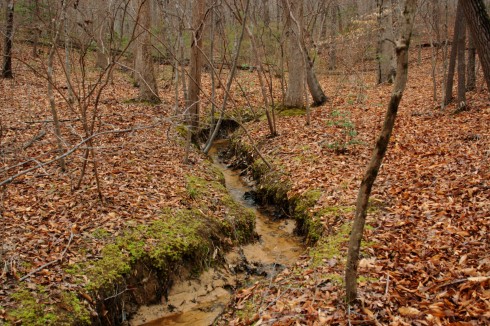
A small, meandering channel. Note the sandy point bars on the inside of the bend, and the overhanging cut-banks on the outside of the curve.

As the stream approached its estuary it would stagnate in places. There, buried leaves and organic matter would decay under the sediment and water in anoxic conditions, rendering their oils and producing natural gas. We’re going to be talking about global warming and the carbon cycle next week so I was quite enthused when students pointed out the sheen of oils glistening on isolated pools of stagnant water.
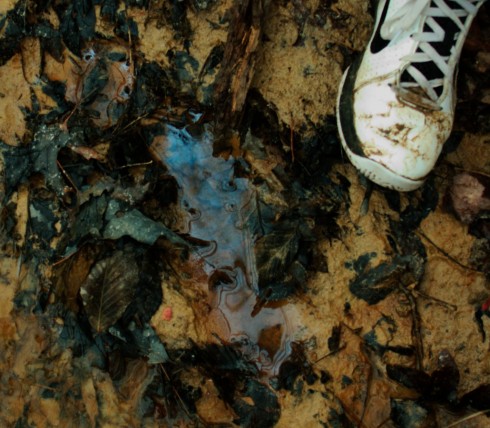
The breakdown of buried organic matter produces gas and oils that are less dense than water.

Finally, we returned to the estuary. It’s much larger than the first one we saw, and it’s flat, swampy with lots of distributaries, and chock full of the sediment and debris of the watershed above it.
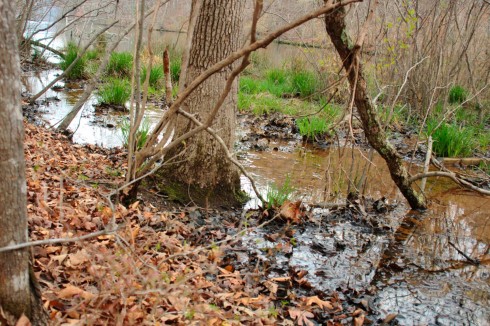
View of the lake from the estuary. The red iron floc in the stream made for a beautiful contrast with the black of the decaying leaves. There is so much red precipitate that it is visible on the satellite image.

This less than three kilometer hike took the best part of two hours. But that’s pretty fast if you value your dawdling.
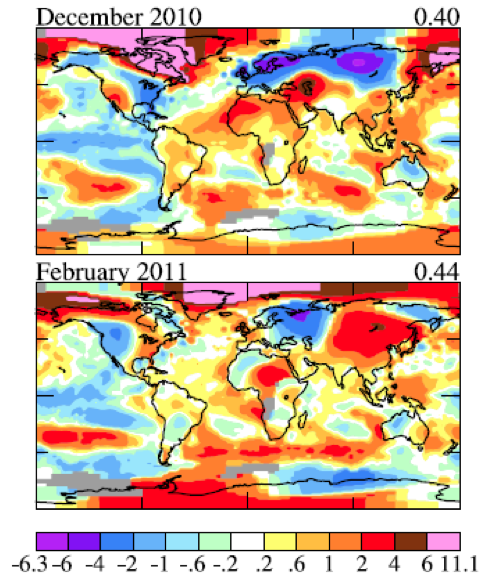
Global Warming: We need new colors.

These maps show the difference between last winter's average temperatures and the long term average (from 1951-1980). Notice that the scale goes up to 11. Image from Hansen and Sato, 2011.

For much of the U.S., last winter was pretty cold. If you look at the maps above, you can see that the eastern United States was up to 4 °C colder than normal in December. However, if you look a little further north into Canada, you’ll see a broad, pink region, where the temperatures were up to 11 °C warmer than normal.

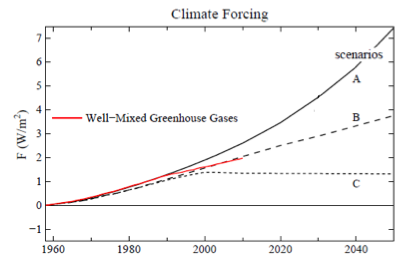
The rate at which the world has been warming has been accelerating. It’s been interesting watching the predictions of the relatively crude computer models of the 1980’s coming true.

The red line show that the actual warming has been awfully close to the middle scenario predicted by climate modelers. The figure was slightly adapted from Hansen and Sato (2011).

Although, it’s really the broadest, more general predictions that tend to be more reliable. One of those predictions, that’s been consistent for a long time and with a lot of different models, is that the poles would warm significantly faster than the rest of the planet.

What’s also been interesting, if somewhat depressing, is seeing the political consensus lag behind the scientific consensus. Twenty years ago there was a real debate in the scientific community about if global temperatures were rising. Now scientists argue mainly about what to do: reduce greenhouse gas pollution, adapt to the inevitable, or some mix of the two. Yet two weeks ago the House Science Committee heard testimony from a professor of marketing, advocating for an end to all government funding of climate research. Perhaps the belief is that if we don’t look it won’t happen.

Curiously, even research teams funded by people who politically oppose global warming, are just confirming the results of all the other scientific groups. Unsurprisingly, they’re now getting heat from their former supporters.

At the same time, Kate (on climatesafety.org) observes that NASA’s James Hansen has had to add a new color (pink on the graphs at the top of the page) to his climate anomaly maps because of the unexpectedly large warming over last winter.

Global Warming update

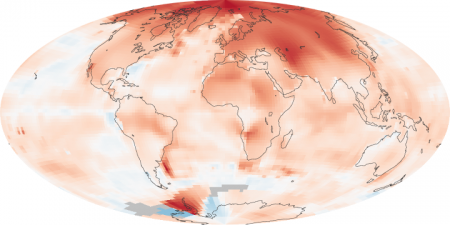
Global temperature difference (anomoly) of 2000-2009 compared to 1950-1980.

NASA’s Earth Observatory is not only a great place for pictures from space, it also posts regular scientific updates, including the most recent map of the change in temperature since 1980.

The most obvious observation from the map is that the poles are warming faster than the rest of the planet, especially the North Pole. This is a pattern that has been predicted since at least the 90’s, so the temperature observations tend to show that the scientists and computer modelers who do this research may just know what they’re doing.

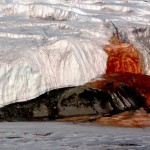
Blood Falls, Antarctica. Note the tent in the lower left for scale. From the U.S. Antarctic Program.

It’s also important to note that the Antarctic is not warming nearly as fast as the Arctic. The continental glaciers that would most significantly raise sea level (think 10’s of meters) are in Antarctica.

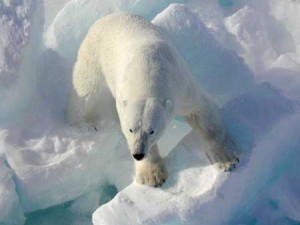
Image from the USGS.

The northern hemisphere warming will likely be difficult for a number of species to deal with. Polar bears, the charismatic megafauna (I love that term) most associated with the effects of the melting Arctic sea-ice, are still in big trouble. Recent research, however, suggests that if something can be done to reduce global warming in the coming century, there will remain places with enough ice that the species may survive.

Update: Interesting article on global warming science and politics in the NY Times. It starts off talking about David Keeling, the scientist who came up with a reliable way to measure atmospheric carbon dioxide.

Planes versus the volcano

CO2 emissions by Planes or Volcano, by David McCandless

David McCandless’ graphic showing the amount of CO2 emitted by the European airline industry compared to the amount emitted by the volcano that shut down that industry for several days is beautiful in its simplicity. It seems that despite the fact that volcanoes emit a lot of CO2, the volcanic eruption reduced total emissions of carbon dioxide into the atmosphere.

Methane hydrates for energy

Despite the fact that methane is a powerful greenhouse gas itself and burning it produces carbon dioxide there is currently quite a bit of research on extracting methane hydrates from the sea floor as an alternative to the traditional fossil fuels because there is just so much of it. Discovery Channel has an interesting video on the topic where they burn some methane hydrate ice.

Methane releases from the arctic and sea-floor could also trigger rapid climate change. Recent discoveries suggest that global warming is warming the arctic so much that the permafrost is melting an releasing a lot of methane into the atmosphere. If the arctic atmosphere continues to warm, more methane will be released, causing more warming …. This positive feedback loop would accelerate global warming. Some scientists worry that warmer ocean waters can melt methane hydrates at the sea floor releasing them into the atmosphere in a similar positive feedback loop.