Here’s a real computer, the Raspberry Pi, for only $25. It has only two ports, one for a monitor and another for a keyboard. I’d suggest it needs one more USB port so you could hook it up to external devices (like robots), if you can’t split the single USB.
Its intention is to bring computer hardware and programming into schools. I’d love to get hold of one.
Excel program for running the Middle School Bank in the personal finance simulation. As you can see, I'm creating an account for my student, Inigo Montoya.
To get students a little more familiar with personal finance, we’re doing a little bank account simulation, and I created a little Excel program to make things a little easier.
It’s really created for the class where students can come up to the bank individually, and the banker/teacher can enter their name and print out their checks as they open their account.
Excel program for running the Middle School Bank in the personal finance simulation.
The front sheet of the spreadsheet (called the “Bank Account” sheet) has three buttons. The first, the “Add New Account” button, asks you to enter the student’s name and it assigns the student an account number, which is used on all the checks and deposit slips. The other two buttons let you delete the last account you entered, and reset the entire spreadsheet, respectively.
One of Inigo's checks (number 4).
Once you’ve created an account the spreadsheet updates the “Checks and Deposit Slips” sheet with the student’s name and account number. If you flip to that sheet you can print out eight checks and five deposit slips, which should be enough to get you through the simulation. The checks are numbered and have the student’s account number on them.
There are two other sheets. One is the “Checkbook Register”, which is generic and each student should get one, and the other is called “Customer Balances”. The latter is set up so you (the teacher) can enter all the deposits and withdrawals the students make, and keep track of it all on the same page.
Yes, it’s a bit of overkill, but I though that, since I was going through the effort, I should probably do a reasonable job. Besides, it gave me a chance to do a little Visual Basic programming to keep my hand in. While I teach programming using VPython (see this for example, but I’ll have to do a post about that sometime) you can do some very interesting things in Excel.
Giles Tran’s amazing rendering of glasses on the counter inspired me to check through my own POV-Ray generated library. Nothing nearly as good, but some of it is still might be useful.
Demonstrating the axial tilt of the Earth, this image shows the Earth at the northern hemisphere's summer solstice.Rotating Earth at the northern hemisphere's winter solstice.
You build 3d models in POV-Ray and then export 2d images from whichever point of view you want, so once you have the model set up you can easily change the perspective or even move objects to create animations.
POV-Ray does not have any useful sort of user interface; you’re usually creating your models with computer code. It can therefore be challenging to use, and, as with any 3d programming language, a bit of geometry, trigonometry and algebra are needed.
However, the final results can be impressive. I’m continually amazed each year by the quality of the work added to their Hall of Fame.
For much easier, quicker and not so sophisticated 3d results, I use VPython, which is also a great way to learn programming that outputs 3d images.
art … never simply transcribes what is “out there,” but selects certain details and arranges them into a harmony that transfigures them.
— Frank Wilson (2010) in “Still life and the alchemy of art“.
We might see arrangements like the stuff sitting on the counter every day, but the image/photography/painting becomes art when the collection is view from a specific perspective that transforms them and highlights details.
Aside from its obvious beauty, what really intrigues me about this picture is where it was taken: In the living room of the Menchers’ apartment, just a few feet from where I was standing. I would never have guessed.
When Eric told me that, I turned and looked, and could see where the vase and the other objects had been placed. But the setting was altogether different from the picture. The living room is a perfectly nice and neat space, and I had just been sitting there, but when I looked at it again there was absolutely nothing about it that would have brought to mind that photo.
Note: The image at the top of this post is computer generated Gilles Tran, using the free, open-source, 3D rendering program POV-Ray. I’ve played around with POV-Ray and it can be a bit tricky, but you can do interesting things.
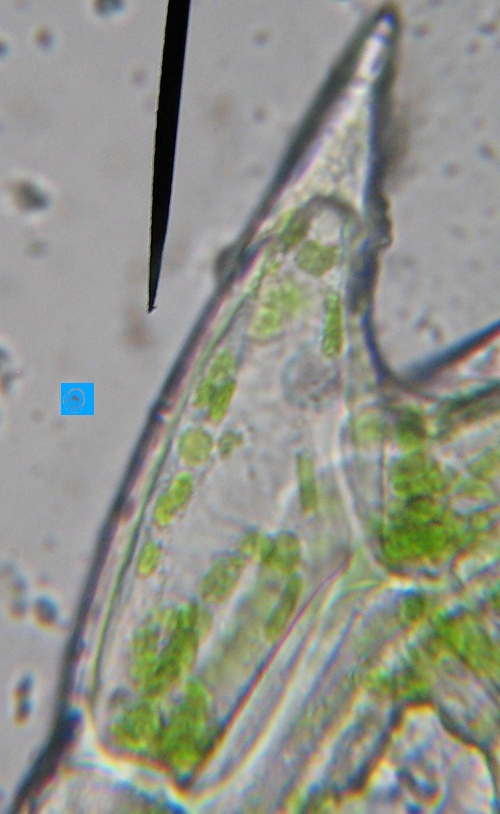
I’m just testing out a simple image map created with the GIMP. The GIMP is a free image manipulation software, a bit like Photoshop, not quite as sophisticated, but free. I used GimpTalk‘s very helpful guide. I though it would be easiest if I used something from a previous post as a test.
You should be able to click on the cell walls, chloroplasts, vacuole and nucleus. The links take you to the associated Wikipedia pages, but that’s just because this is a quick and dirty example. Image maps have been around for a long time, but I believe this is the first time I’ve ever created one. Now I just need to animate it a bit.
Unfortunately, this image is not easily scalable, though it should not be too hard to find (or write) a script to do just that.
We read that temperature is the average kinetic energy of a substance but you can (especially if you’re a visual learner) nicely internalize this from simple videos or animations. UCAR has a little animation with their definition of temperature. I however, adapted an interactive, 3d animation that I think does a nice job, and also introduces a couple of other interesting concepts too.
I’ve also used this model, at different times, to show:
The relationship between temperature and color emitted by objects. The main way we know the temperature of stars is because blue stars are hotter than red stars. Blue light has a shorter wavelength than red light, and things that are at higher temperatures emit shorter wavelengths.
Absolute zero (0 Kelvin) – where (almost) all motion stops and the objects stop emitting light.
Pressure in a gas – you really get a feel for the force exerted by the particles on the side of the box (although it might be even more interesting once I figure out how to add sound).
It is an interactive model, but it’s pretty simple because the only control is a slider that lets you set the temperature.
Finally, in the age of 3d movies, like Avatar, the models can be easily shown in 3d if you have the glasses (redcyan).
The model is easy to install and run on Windows, but you have to install the programming language VPython separately on a Mac (but that isn’t very hard). I have this, and a bunch of other models, at http://earthsciweb.org/GeoMod/.
An interesting thing happened last week that I perhaps should have anticipated. Because we had a little extra time during Thanksgiving week I offered to do a technology lesson on 3d programming if anyone was interested. One student was very interested and a couple others wanted to do it later. I usually try to do basic lessons for everyone at the same time in order to save time, but because the one students was very excited about the lesson I just gave it to them.
Over the next two days, the first student had given the lesson to another who’d planned to wait until later, and I was having requests from other students who had not been interested in programming at all to be able to do the subject.
I guess I learned a couple things from this. First, that asynchronous lessons might be something I should do more often. If certain students are more interested in the subject then the lesson is more effective given to them. Second, that student interest in infectious. If they are excited about a subject they tend to want to share with others, and that seems like a very effective way of propagating information; each student only gets the info when their interest has been sparked. Furthermore, since different students are more interested in different subjects they, theoretically, all have the opportunity to be the expert, if they’re interested in that type of recognition. The trick, I guess, is making sure that everyone gets the lesson and information at some point before they loose interest.