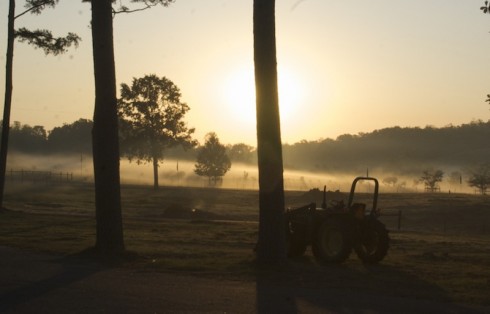
Fog on the Downs and Lake

Early morning.

The first few mornings at Heifer were cold. About five or six degrees Celcius (in the 40’s Fahrenheit) at sunrise. The large barn we slept in had been “converted” from housing horses to housing people. Apparently, horses prefer wide-open, drafty places.

But a warm sleeping bag goes a long way. And being forced to wake up just before the break of dawn does have certain advantages. I’m rarely up and about in time to capture the morning light. With the early morning fog drifting across the slopes and rising off the lake, those first few mornings were wonderful for photography.

Sunrise is usually the coldest time of day. After all, the Sun’s been down all night, and is only just about to start warming things up again. Cold air can’t hold as much moisture (water vapor) as warm air, so as the air cools down overnight the relative humidity gets higher and higher until it can’t hold any more – that’s called saturation humidity; 100% relative humidity. Then, when the air is saturated with water vapor, if it cools down just a little more, water droplets will start to form. The cooler it gets the more water is squeezed out of the air. Water vapor in the air is invisible, but the water droplets are what we see as fog. Clouds are big collections of water droplets too; clumps of fog in the sky.

Early morning fog drifts over the lake.

Weather versus Climate: The Seasonal Migration of the Sub-Polar Low

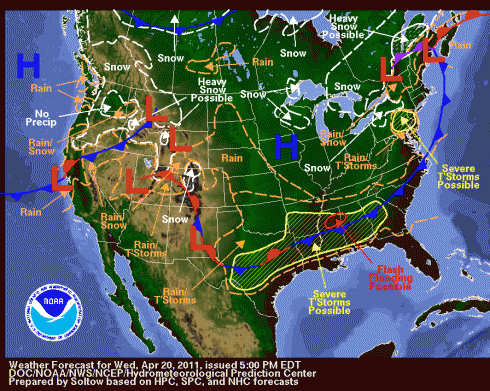
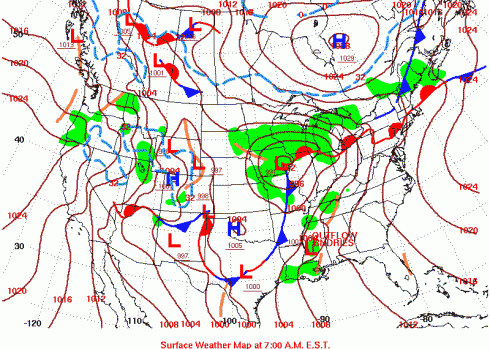
The cold front of this mid latitude cyclone spawned several fatal tornados on April 28, 2011. The cold front is the blue line with triangles pointing toward the east. Image via NOAA HPC.

The cold fronts of mid-latitude cyclones bring thunderstorms, rain and spawn tornadoes like the ones we’ve seen over the last few days. In the spring and fall, these cyclones just sweep across the southern U.S. again and again. The line of their passage sort-of marks the northward migration of the sub-polar low in picture of the global atmospheric circulation system.

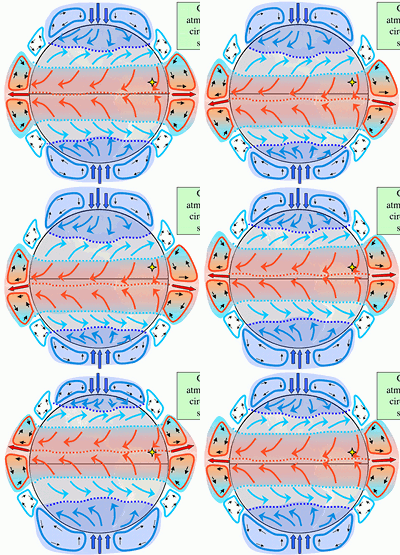
The circulation cells of the global atmospheric circulation system migrate north and south with the seasons. Image links to larger version (1 Mb).

Each individual front, with its storms, is a feature of the weather. Climate, on the other hand, is the result of the average position over time: the series of fronts which make the southern U.S. wet in the spring and fall.

The sub-polar low is not the only feature that brings lots of seasonal rain. The ITCZ does also, and the rains that the ITCZ’s movement north and south of the equator bring, are what we call the monsoons. The yellow star on the animation, just to the north of the equator, sees monsoonal rains in the summer. Since the ITCZ follows the sun with the seasons, the monsoons always come in the summer; even in the southern hemisphere.

Parting the Red Sea: Biblical Scenes from Space and Computer Modeling on the Earth

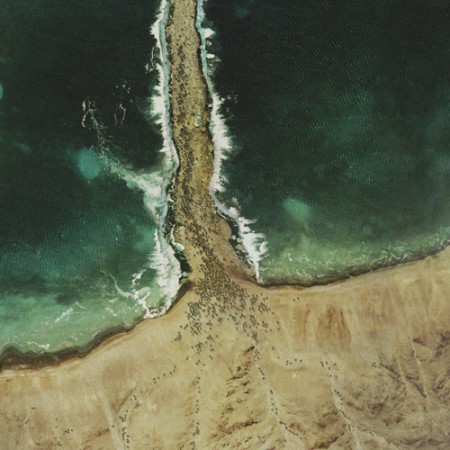
A God's Eye View of Moses parting the Red Sea. Image from the Glue Society.

The Glue Society has a most interesting set of satellite images modified to look like major biblical scenes. CreativeReview has more pictures and details, including of the crucifixion and Noah’s Ark.

“We like to disorientate audiences a little with all our work. And with this piece we felt technology now allows events which may or may not have happened to be visualized and made to appear dramatically real,” say The Glue Society’s James Dive. “As a method of representation satellite photography is so trusted, it has been interesting to mess with that trust.”
— CreativeReview (2007): The Bible According To Google Earth

I think this topic came up when we were talking about atmospheric circulation. The question was about if the winds generated descending, diverging air could have parted the Red Sea. The answer was no, because the general atmospheric circulation system is a thing of climate — averages of the weather — while any winds strong enough to part the red sea would be actual weather, like the storms we seem to have been seeing every day for the last few weeks.

Oddly enough, just last year researchers from the University Corporation for Atmospheric Research (UCAR) did a computer model that showed that hurricane force winds from the northwest could have uncovered an underwater reef to allow Moses his passage (the article is Drews and Han, 2010).

However, the scientists found:

[The] reef would have had to be entirely flat for the water to drain off in 12 hours. A more realistic reef with lower and deeper sections would have retained channels that would have been difficult to wade through. In addition, Drews and Han were skeptical that refugees could have crossed during nearly hurricane-force winds.
— NCAR & UCAR News Center (2010): Parting the waters: Computer modeling applies physics to Red Sea escape route.

NPR’s article on the topic is worth a listen.

Power Down and Disconnected

Like addicts racing to get their overdue fix, my students raced to the computers this afternoon after having had to survive all day without power and without the internet. I’ll confess that I felt the same urge, but was able to restrain it. Until now.

We usually don’t have internet access during our immersions, but then it’s expected and students are not inside needing to refer to the study guides to figure out their assignments. At the beginning of the year I gave everyone paper copies of the study guides, but now there are just a core few who request them.

Fortunately, we had a couple of smart-phones so one student would look up the reading assignment and post the page numbers on the whiteboard. Fortunately, the reading assignments were out of the book.

We weren’t quite surviving without technology, but it was close, and students were getting innovative.

We’ve had storms every few days for the last couple of weeks, which is typical for Memphis at this time of year. Over the last few days a frontal system has just been pushing back and forth over us. When it pushes south we get a cold front with thunderstorms and rain, but clear skies afterward. When the front pushes north it gets warm and humid, and the sky goes overcast for most of the day.

Weather map for Wednesday, April 20th. The blue and red line passing through the southeastern U.S. show the mixed warm and cold fronts that have been oscillating past Memphis for days. Image from the National Weather Service.

This line of fronts marks the general location of the sub-polar low, which is moving north with the spring. But more on that tomorrow.

First frost

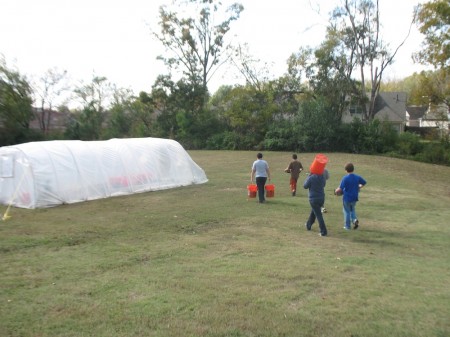
Transporting plants into the greenhouse.

The temperature dropped below zero (Celcius) for the first time last Friday night. We’d put back up the greenhouse’s plastic cover, which had blown off a couple weeks ago in a wind storm, but that was not enough to save a couple tomatoes and a squash plant.

It was a good illustration of the effects of freezing on plants not adapted to the colder weather. The leaves all turned black and flopped over, probably because the expanding ice ruptured the cell walls.

It also indicates that I need to get at temperature data-logger so I can monitor the temperature inside and outside the greenhouse. In the spring I hope to start a bunch of plants inside but put them into the greenhouse at the first opportunity, but I’ll need to make sure that greenhouse can support them. The data logger will also allow for some interesting experiments.

Amazing storm

I appreciate how much you more of the weather you can observe using time lapse photography, but its astonishing when you don’t even need the time lapse.

While this storm seems like something out of the movie “Day After Tomorrow”, I wonder how much more freaky weather we’re seeing just because of the new ubiquity of video cameras.

Nashville flooding and mid-latitude cyclones

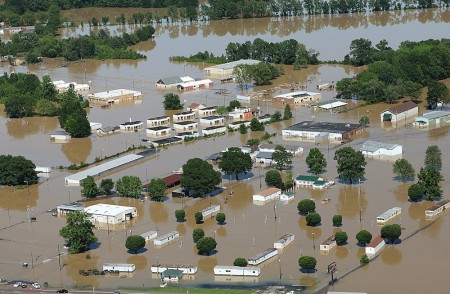
Nashville, TN, May 4, 2010. (photo by David Fine/FEMA)
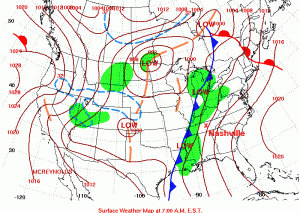
Daily weather map for May 2nd, 2010. Note the cold front heading toward Nashville. Map from the Hydrometeorological Prediction Center.

Over 30 cm of rainfall in just two days resulted in extensive flooding in Nashville, TN, last week. The precipitation was produced by one of those typical mid-latitude cyclones that sweep across the United States, from west to east, every spring and fall. The Boston Globe has some amazing picture of the flooding.

The news media tends to have the most dramatic photographs of disasters, but the Federal Emergency Management Agency (FEMA) also tends to have good images from their aerial surveys (like the image at the top of this post). And images produced by the government are in the public domain so you don’t have to worry about using them.

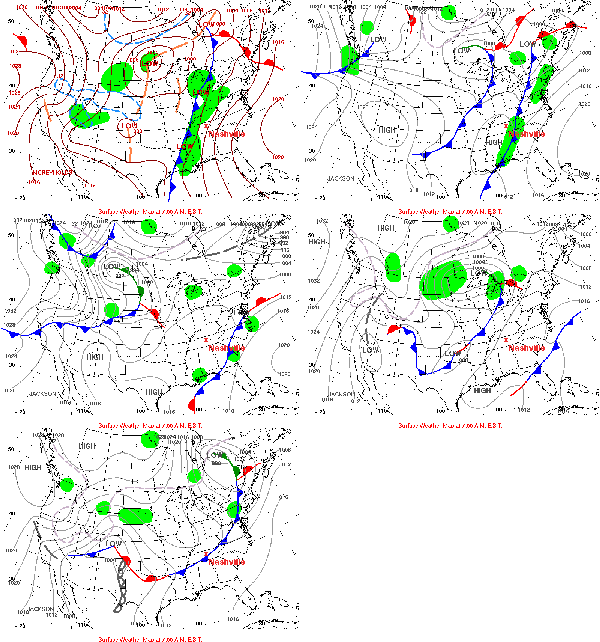
May 2-6 fronts. Animation generated using images from the HPC.

For discussing warm fronts, cold fronts and mid-latitude cyclones, NOAA‘s Hydrometeorological Prediction Center (HPC) is a great resource. You can find an archive of daily weather maps for the U.S. that you can click through to see the fronts move.

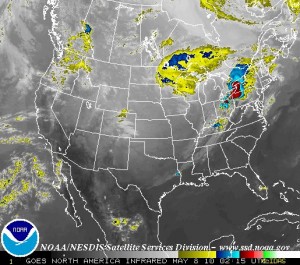
Infra-red satellite image of the continental U.S.. Note the alignment of the clouds and precipitation with the fronts in the first (static) weather map above. (Image from GOES).

Satellite imagery usually complements to the frontal weather maps very well. Most satellites orbit around the Earth pretty quickly, at just the right orbital speed that the centrifugal force just balances the Earth’s gravity so the satellite does not crash into the atmosphere or escape into space. Some satellites are set into orbit a bit further out so that they can rotate with the Earth, effectively staying above the same place all the time. NOAA has a few of these geostationary satellites monitoring the weather around the world, and you can get real-time images from the Geostationary Satellite Server. There used to be archived satellite images but I can’t seem to find them at the moment.

Snowfall

To accurately observe nature sometimes takes time. Land-labs are intended to get students out into nature for a week at a time throughout the entire year so that they can see the change in the seasons. But sometimes you need to winnow things down, speed things up, to observe the slow changes that you just miss. Time-lapse photography is one great way to do this.