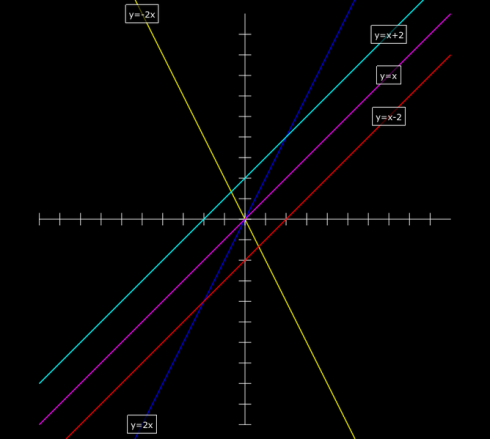
My high school pre-Calculus class is studying the subject using a graphical approach. Since we’re half-way through the year I thought it would be useful to introduce some programming by building their own graphical calculators using Vpython.
Now, they all have graphical calculators, and Vpython does have its own graphing capabilities, but they’re fairly simple, only 2-dimensional, and way too automatic, so I prefer to have students program the calculators in full 3d space.
My approach to graphing is fairly simple too, but its nice because it introduces:
- Co-ordinates: Primarily in 2d (co-ordinate plane), but 3d is easy;
- Lists: in this case its a list of coordinates on a line;
- Loops: (specifically for loops) to repeat actions and produce a sequence of numbers (with range); and
- A sideways glance at matrix-like operations with arrays: A list of numbers can be treated like a matrix in some relatively simple circumstances. However, it’s not real matrix operations: multiplying a scalar by a list works like real matrix multiplication, but multiplying two lists multiplies the corresponding elements in the list.
A Simple Graphing Program
Start the program with the standard vpython header:
from visual import *
x and y axes: curves and lists
Next create the x and y axes. This introduces the curve object and lists, because Vpython draws its curve from a series of points held in a list.
To keep things simple, we’re letting the graph go from -10 to positive 10 along both axes, which makes the x-axis a line segment with only two points:
line_segment = [(-10,0), (10,0)]
The square brackets say that what’s inside as a list. In this case it’s a list of two coordinate pairs, (-10,0) and (10,0).
Now we create a line using Vpython’s curve and tell it that the positions of the points on the curve are the ones we just defined:
xaxis = curve(pos=line_segment)
To create the y-axis, we do the same thing but change the coordinate pair to (0,-10) and (0,10).
line_segment = [(0,-10),(0,10)]
yaxis = curve(pos=line_segment)
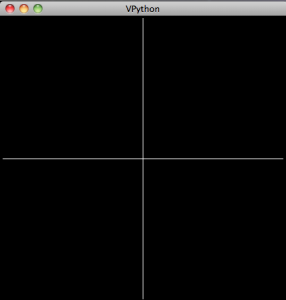
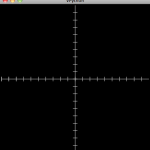
Which should produce:
Tic-marks: loops
In order to be better able to keep track of things, we’ll need some tic-marks on the axes. Ideally we’d like to label them too, but I think it works well enough to save that for later.
I start by having students create the first few tic-marks and then look for the emerging pattern. Their first attempts usually look something like this:
mark1 = curve(pos=[(-10,0.3),(-10,-0.3)])
mark2 = curve(pos=[(-9,0.3),(-9,-0.3)])
mark3 = curve(pos=[(-8,0.3),(-8,-0.3)])
mark4 = curve(pos=[(-7,0.3),(-7,-0.3)])
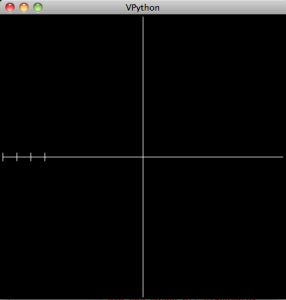
However, instead of tediously writing out these lines we can automate it by noticing that the only things that change are the x-coordinate of the coordinate pairs: they go from -10, to -9, to -8 etc.
So we want to produce a set of numbers that go from -10 to 10, in increments of 1, and use those number to make the tic-marks. The range function will do just that: specifically, range(-10,10,1). Actually, this list only goes up to 9, but that’s okay for now.
We tell the program to go through each item in the list and give its value to the variable i using a for loop:
for i in range(-10,10,1):
    mark = curve(pos=[(i,0.3),(i,-0.3)])
In python, everything indented after the for statement is within the loop.
The y-axis’ tic-marks are similar, and its a nice little challenge for students to figure them out. They usually come up with a separate loop, eventually, that looks something like:
for i in range(-10,10,1):
    mark = curve(pos=[(0.3, i),(-0.3,i)])
The Curve
Now to create a line we really only need two points. However, so that we can make other types of curves later on we’ll create a line with a series of points. We’ll create the x and y values separately:
First we set up the set of x values:
line = curve(x=arange(-10,10,0.1))
Note that I use the arange function which is just like the range function but gives you decimal values (so you can do fractions) instead of just integers.
Next we set the y values that go with the x values for the equation (in this example):
![]()
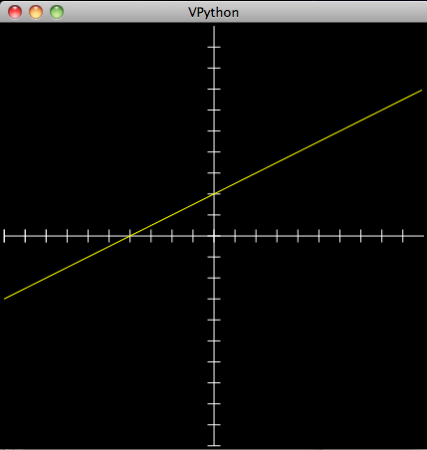
line.y = 0.5 * line.x + 2
Finally, to make it look better, we change the color of the line to yellow:
line.color = color.yellow
In Summary
The final code looks like:
from visual import *


line_segment = [(-10,0),(10,0)]
xaxis = curve(pos=line_segment)

line_segment = [(0,-10),(0,10)]
yaxis = curve(pos=line_segment)

mark1 = curve(pos=[(-10,0.3),(-10,-0.3)])
mark2 = curve(pos=[(-9,0.3),(-9,-0.3)])
mark3 = curve(pos=[(-8,0.3),(-8,-0.3)])
mark4 = curve(pos=[(-7,0.3),(-7,-0.3)])

for i in range(-10,10,1):
    mark = curve(pos=[(i,0.3),(i,-0.3)])

for i in range(-10,10,1):
    mark = curve(pos=[(0.3, i),(-0.3,i)])


line = curve(x=arange(-10,10,0.1))
line.y = 0.5 * line.x + 2
line.color = color.yellow
which produces:
Note on lists, arrays and matrices: You’ll notice that we create the curve, give it a list of x values (using arange), and then calculate the corresponding y values using matrix multiplication: 0.5 * line.x. This works because line.x actually stores the values as an an array, not as a list. The key difference between lists and arrays, as far as we’re concerned, is that we can get away with this type of multiplication with an array and not a list. However, an array is not a matrix, as is clearly demonstrated by the second part of the command where 2 is added to the result of the multiplication. In this case, 2 is added to each value in the array; if it were an actual matrix you need to add another matrix of the same shape that’s filled with 2’s. Right now, this is invisible to the students. The line of code makes sense. The concern is that when they do start working with matrices there might be some confusion. So watch out.
And to make any other function you just need to adjust the final line. So a parabola:
![]()
would be:
line.y = line.x**2
(The two stars “**” indicates an exponent).
An Assignment
So, to assess learning, and to review the different functions we’ve learned, I asked students to produce “studies” of the different curves by demonstrating what happens when you change the different constants and coefficients in the equation.
For a straight line the general equation is:
![]()
you what happens when:
- m > 1;
- 0 < m < 1;
- m < 0
and:
- b > 1;
- 0 < b < 1;
- b < 0
The result is, after you add some labels, looks something like the image at the very top of this post.
This type of exercise can be done for polynomials, exponential, trigonometric, and almost any other type of functions.