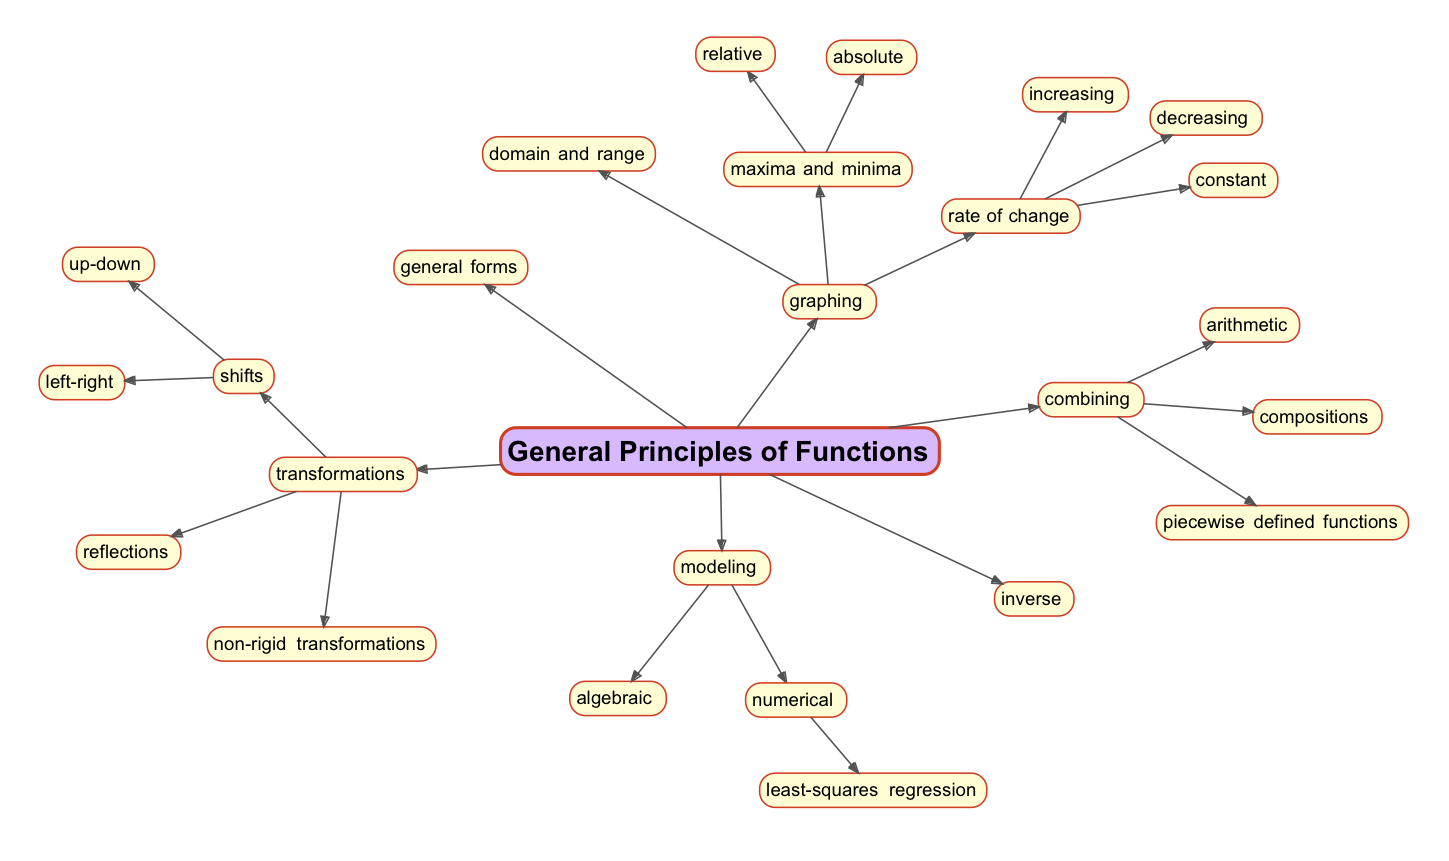
This year I’m trying teaching pre-Calculus (and it should work for some parts of algebra as well) based on this concept map to use as a general way of looking at functions. Each different type of function can by analyzed by adapting the map. So linear functions should look like this:

You’ll note the bringing water to a boil lab at the bottom left. It’s an adaptation of the melting snow lab my middle schoolers did. For the study of linear equations we’ll define the function using piecewise defined functions.
