My Memory is in the Ether

The experience of losing our Internet connection becomes more and more like losing a friend.

— Sparrow et al., 2011: Google Effects on Memory: Cognitive Consequences of Having Information at Our Fingertips (pdf).

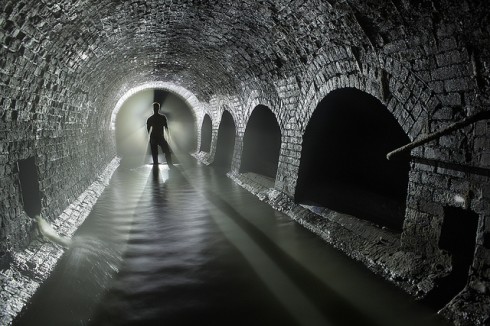
Internet on the brain. Image creating using internet map by Matt Britt (via Wikipedia).

Last year, my students informed me that humans have a fundamental need for electronics. And I was forced to agree. We’re becoming more inseparable from our devices, practically all of which are connected to the internet. So much so, that people aren’t spending the time memorizing all the stuff they used to memorize, and are instead just remembering where to find it (or what search terms to google).

The results of four studies suggest that when faced with difficult questions, people are primed to think about computers and that when people expect to have future access to information, they have lower rates of recall of the information itself and enhanced recall instead for where to access it. The Internet has become a primary form of external or transactive memory, where information is stored collectively outside ourselves.

— Sparrow et al., 2011: Google Effects on Memory: Cognitive Consequences of Having Information at Our Fingertips (pdf).

Since one of the prime reasons for this blog was to help me remember all the stuff I usually forget (and where to find all the stuff I usually forget), I have to say that these results have the scent of truth. Our cyborgization continues.

So, given this shift to outsourcing our memories, it seems even more imperative that students learn how to think and solve problems, and where to look to find good information they can use in their problem solving, rather than work more on memorization of facts. There are fast becoming too many fact to memorize, and they’re almost all accessible on the internet.

Astronomic Symbols

Symbols of the major bodies in the solar system. (Image from NASA).

NASA has a nice, simple page showing the symbols astronomers use for the major bodies in the solar system and describing what they represent. The symbols are a shorthand that make it easier to take notes and draw diagrams. The Wikipedia page has a lot more detail if you need it.

Galileo Galilei's notes showing the phases of Venus, published in Il saggiatore in 1623. (Image from Galileo's Telescope).

Alas, despite their long history of use – 2500 years or more – these symbols can be the source of some very adolescent humor, so beware.

Scaffolding and Peer-learning: Thinking about Vygotsky’s “Zone of Proximal Development”

When a student is struggling with a problem, and they just need that little boost to get them to the next level, they’re in Vygotsky’s Zone of Proximal Development, and it’s appropriate for the teacher to give them that crucial bit of help. The idea implies that students really have been trying to solve the problem so the help they get will be useful.

It also implies that the teacher can recognize precisely the help they need and deliver it, which is often easier than it sounds. As an adult, from a different generation and culture, and with more experience with these problems, I see problems very differently from my students. Indeed, experts solve problems by developing rules of thumb (heuristics) that speed problem solving by amalgamating large volumes of information. Unfortunately, for these heuristics to be meaningful, students often have to arrive at them themselves. Thus the student looking at the details is unable to communicate effectively with the expert who sees the big picture.

Peer-Teaching

One remedy Vygotsky advocated was peer-teaching. By letting students of similar but differing abilities work in groups, they can help each other: often a lot more effectively than a teacher would be able to. The teacher’s main interventions can be with the more advanced students who do not have anyone more knowledgeable to help, but who are best able to communicate with the teacher because of a smaller knowledge gap.

Practically, this suggests multi-aged classrooms, and a high level of vertical integration of the subject matter. Consider, for example, which topics from algebra, geometry and calculus might be appropriate for students from middle to high school to be working on together at the same time in the same room.

Scaffolding

Another, more typical, approach to this problem would be to provide all the extensive scaffolding – all the information including explicit demonstrations of ways of thought – that students need to get started, and then gradually take the scaffolding away so that they have to apply it all on their own.

In a high school laboratory science class, a teacher might provide scaffolding by first giving students detailed guides to carrying out experiments, then giving them brief outlines that they might use to structure experiments, and finally asking them to set up experiments entirely on their own.

Slavin (2005) (online resources): Classroom Applications of Vygotsky’s Theory.

In Combination

Elements of both these approaches are necessary – and they’re not mutually exclusive. The scaffolding perspective is most important when introducing something completely new, because they’re all novices at that point. But as you build it into the classroom culture in a multi-aged classroom where there is institutional memory and peer-teaching, then the job of the teacher evolves more into maintaining the standards and expectations, and reduces (but does not eliminate) the need for repeatedly providing the full scaffolding.

The Aurora Borealis and Atomic Structure

The Auroras are a great natural phenomena that relates to elements, the structure of atoms, and ionization. They also tie into the physics of charged particles in magnetic fields. The video below provides and excellent overview and also brings up nuclear fusion and convection.

The Aurora Borealis from Per Byhring on Vimeo.

This video explains how particles originating from deep inside the core of the sun creates northern lights, also called aurora borealis, on our planet.

See an extended multimedia version of this video at forskning.no (only in Norwegian):
http://www.forskning.no/artikler/2011/april/285324

———–

This video is produced by forskning.no in collaboration with the Department of Physics at the University of Oslo.

Production, animation and music: Per Byhring
Script: Arnfinn Christensen
Scientific advisors: Jøran Moen, Hanne Sigrun Byhring and Pål Brekke
Video of the northern lights: arcticlightphoto.no
Video of coronal mass ejection: NASA

Beach Geomorphology on Deer Island

Figure 1: Beach profile on Deer Island spit.

The western end of Deer Island extends a white, sandy, artificial, spit that partially covers the first of a series of riprap breakwaters that protect the waterfront development of the city of Biloxi. Although we’d landed there to pick up garbage as part of our coastal science camp, the beautifully developed beach profile was worth a few minutes.

Figure 2: Narrow beach typical of the east-west trending shorelines that are not exposed to the direct force of the waves.

The spit curves just ever so slightly northward, so it feels more of the direct force of waves blown all the way along the length of Biloxi Bay. The combination of unvegetated sand and stronger waves makes the beach along the spit looks very different from the beaches that parallel the shore. While the parallel beaches on Deer Island are covered in grass almost to the water’s edge (Fig. 2), the spit has a much wider beach, with a nicely developed sandbar protecting a shallow, flat-bottomed, water-saturated trough behind it (Fig. 1).

While the white beaches are pretty (that’s why they imported this sand after all), there are a number of fascinating features in the trough.

Figure 3: On our Natchez Trace hike we found it quite easy to stick fingers into the red precipitate at the bottom of the stream.

The first, and most obvious question is, why the reddish-orange color in the fine grained sediment at the bottom of the trough? A microscope and a little geochemical analysis would be useful here, however, lacking this equipment, we can try drawing parallels with some of our experiences in the past. In fact, we should remember seeing the same color in some of the streambeds when we were hiking in Natchez Trace State Park in Tennessee (Fig. 3). My best guess at that time was that the red was from iron in the groundwater being oxidized when it reached the surface.

Figure 4: The rich black of decaying organic matter, sits just beneath the rusty-orange surface sediement.
Figure 5: Green, organic matter, freshly deposited at the edge of the trough. If it decays while saturated with water it will turn black. Note also the splay of white sand at the top of the picture.

This is probably not a bad guess for the red in the trough as well, since there is some fresh groundwater discharge from the shallow watertable on the island. However, I suspect that the story is a bit more complex, because the rich black color of the organic matter just beneath the surface (Fig. 4) suggest that the shallow water and surface sediment in the trough is lacking in oxygen. On the other hand, it’s not uncommon to have steep geochemical gradients in boundary environments like this one.

The physical and geochemical gradients extend horizontally as well as vertically. At the edges of the trough the organic matter just beneath the surface is green, not black (Fig. 5), because this is the color of the undecayed algae.

At the seaward side of the beach, the waves of Biloxi Bay lap against the sand bar. When the tide rises, and the wind picks up, these waves wash over the crest of the sand bar pushing water and sediment over the top into trough. When the sand washes evenly over the top it creates thin layers (possibly one layer with each high tide). If you cut into these layers you’ll see little the laminations in profile, which, because the layering is close to horizontal, look like the lines of topography on a map (Fig. 6). When the waves wash over small gaps in the sandbar the sediment it transports is deposited in a more concentrated area – these are called sand splays – that overlap and cover some of the fine-grained, orange sediment at the edge of the trough. These are both two of the small ways that the sand bar moves, slowly pushing inland.

Figure 6: Sand splay and laminations on the landward side of the sand bar. The laminations are created by even overwash of the sandbar, while the splay is the result of more concentrated flow.

Bioturbation

The features on the bottom of the trough are a quite interesting because of the observable effects of bioturbation (disturbance by organisms) (Figs. 7, 8 & 9).

Figure 7: In close-up, the holes of the crabs and the mixture of colors looks like an arid, volcanic landscape photographed from space.
Figure 8. Digging deep beneath the orange surface sediment, small crabs create mounds of white sand.
Figure 9. Footprints of predators. Paleontologists use features like these that are preserved in rocks to discover interpret what the relationships between organisms was like in the past.

You Value Learning More if You Discover Things for Yourself

A key tenant of Montessori is that students have an innate desire to learn, so, as a teacher, you should provide them with the things they need (prepare the environment) and then get out of the way as they discover things themselves.

Upside of Irrationality

In the book, The Upside of Irrationality, Dan Ariely explains from the perspective of an economist how people tend to value things more if they make it for themselves. He uses the example of oragami (and Ikea furniture that you have to assemble yourself), where he finds that people would pay more for something they made themselves, as opposed to the same thing made by someone else.

Just so, students value things more, and remember them better, if they discover them themselves.

(video via The Dish)