A good NPR article based on a 2014 paper that finds that students who hand-write their notes have to think more about what they choose to write and so remember better than students who just transcribe lectures on their computers.
Author: Lensyl Urbano
DIY Plastic Recycling Workshop
Thanks to Natasha for sending me this link. Precious plastic shares the technology to build your own modular plastics recycling workshop.
Volumes of Revolution

It can be tricky explaining what you mean when you say to take a function and rotate it about the x-axis to create a volume. So, I made an OpenScad program to make 3d prints of functions, including having it subtract one function from another. I also 3d printed a set of axes to mount the volumes on (and a set of cross-sections of the volumes being rotated.
The picture above are the functions Mrs. C. gave her calculus class on a recent worksheet. Specifically:

from which is subtracted:

The Rules of Cricket
Our students organized an International Day and asked me to demonstrate cricket. Here’s a good introduction to the rules of cricket.
Chessboard Project

For our annual fundraiser’s silent auction, I made a chess board. The structure was made of wood–I learned how to use dowels to attach the sides–but the black squares were cut out of the material they use for matting the borders of pictures. My student drew “cheat sheet” diagrams of each of the black squares in bright gel pen colors. The squares were laid on a white grid and the entire top epoxied with a clear glass-like coat. We also made two sets of chess pieces with the 3d printer (rounds versus squares).
It turned out quite well.

Nukemap
“If I were to convert all of my body, my mass to energy, how much could I blow up?”
The Nukemap website tries to help answer that question.
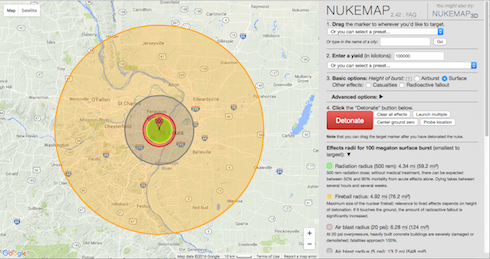
However, if we use the equation E = mc2, we can convert a 50 kg student into the explosive energy of the equivalent of 1,000,000 kilotons of TNT, which the newer website can’t quite handle.
Physics: Theories of Everything (Mapped)
An excellent overview of the multitude of active theories and hypotheses–like quantum gravity, string theory–physicists are investigating to try to explain the universe.
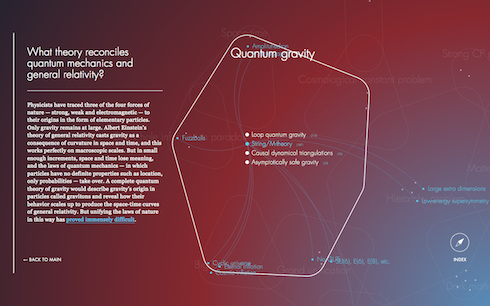
In the quest for a unified, coherent description of all of nature — a “theory of everything” — physicists have unearthed the taproots linking ever more disparate phenomena. With the law of universal gravitation, Isaac Newton wedded the fall of an apple to the orbits of the planets. Albert Einstein, in his theory of relativity, wove space and time into a single fabric, and showed how apples and planets fall along the fabric’s curves. And today, all known elementary particles plug neatly into a mathematical structure called the Standard Model. But our physical theories remain riddled with disunions, holes and inconsistencies. These are the deep questions that must be answered in pursuit of the theory of everything.
–Natalie Wolchover in Theories of Everything Mapped on Quanta Magazine.
Interactive Electric Fields (with Paper.js)
Drag the charges around.
The force field created by the interaction of two electric charges (one positive and one negative). The source is at http://soriki.com/fields/electric/.