The magnitude 8.9 earthquake that devastated coastal areas in Japan shows up very clearly on the United States Geologic Survey’s recent earthquake page.
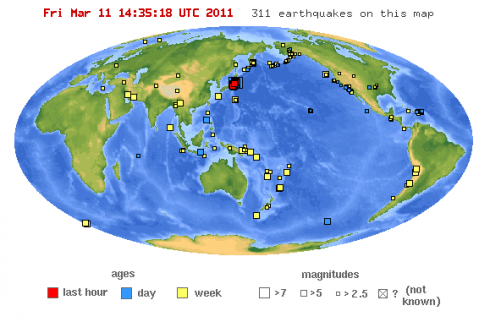
Based on our studies of plate tectonics, we can see why Japan is so prone to earthquakes, and we can also see why the earthquake occurred exactly where it did.
The obvious trench to the east and the mountains and volcanoes of the Japanese islands indicate that this is a convergent margin. The Pacific plate is moving westward and being subducted beneath the northern part of Japan, which is on the Okhotsk Plate.
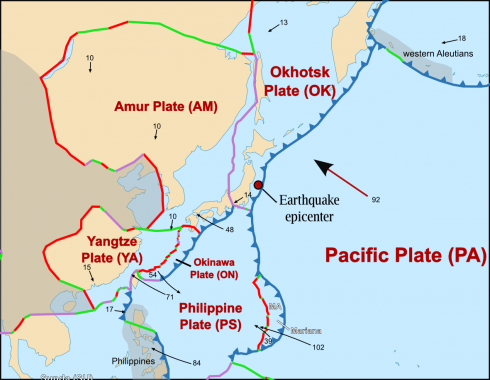
The epicenter of the earthquake is on the offshore shelf, and not in the trench. Earthquakes are caused by breaking and movement of rocks along the faultline where the two plates collide.
In cross-section the convergent margin would look something like this:
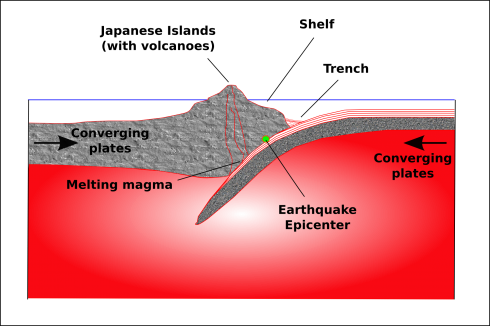
The shaking of the sea-floor from the earthquake creates the tsunamis.
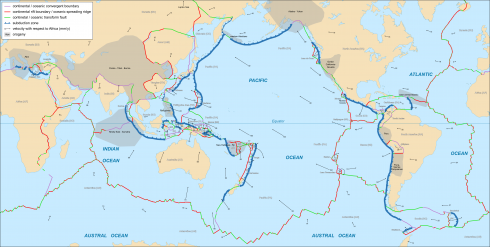
So where are there similar tectonic environments (convergent margins)? You can use the Google Map above to identify trenches and mountain ranges around the world that indicate converging plates, or Wikimedia Commons user Sting’s very detailed map, which I’ve taken the liberty of highlighting the convergent margins (the blue lines with teeth are standard geologists’ markings for faults and, in this case, show the direction of subduction):
The Daily Dish has a good collection of media relating to the effects of the quake, including footage of the tsunami inundating coastal areas.
Cars being washed away along city streets:
Our thoughts remain with the people of Japan.
UPDATES:
1. Alan Taylor has collected some poignant pictures of the flooding and fires caused by the tsunami and earthquake. TotallyCoolPix has two pages dedicated to the tsunami so far (here and here).
2. Emily Rauhala summarizes Japan’s history of preparing for this type of disaster. They’ve done a lot.
3. Mar 12, 2011. 2:10 GMT: I’ve updated the post to add the map of the tectonic plates surrounding Japan.
4. A CNN interview that includes video of the explosion at the Fukushima nuclear power plant (my full post here).
5. NOAA has an amazing image showing the tsunami wave heights.
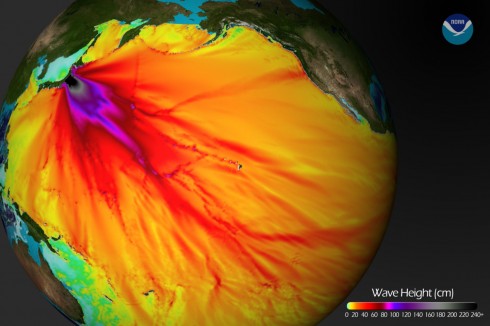
They also have an excellent animation showing the tsunami moving across the Pacific Ocean. (My post with more details here).
6. The United States Geological Survey (USGS) put out a podcast on the day of the earthquake that has interviews with two specialists knowledgeable about the earthquake and the subsequent tsunami, respectively. Over 250 kilometers of coastline moved in the earthquake which is why the tsunami was so big. They also have a shakemap, that shows the area affected by the earthquake.
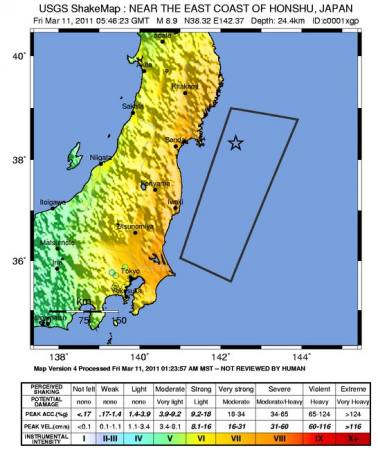
7. ABC News (Australia) and Google have before and after pictures.
8. The University of Hawaii has a page about, Why you can’t surf a tsunami.
9. A detailed article on earthquake warning systems, among which, “Japan’s system is among the most advanced”, was recently posted in Scientific American.
10. Mar 15, 2011. 9:15 GMT: I’ve added a map of tectonic boundaries highlighting convergent margins.
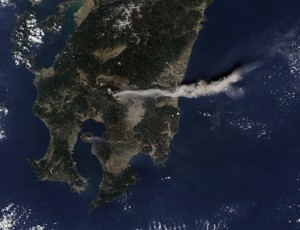
11. The Shinmoedake Volcano erupted two days after the earthquake, but they may be unrelated.
12. The Guardian’s live blog has good, up-to-date information on the status of the nuclear reactors at Fukushima.
