DNA Extraction Labs

My middle school class tried DNA extractions from dried split peas and cheek cells for a lab this week, and the experiments went rather well.

Strands of DNA rising from the interface between crushed split pea “sludge” and rubbing alcohol. Bubbles trapped beneath the strands make for interesting convective-like patterns.

Split Pea DNA

For the split peas, we followed the Learn.Genetics lab. I blended the peas in some salty water at the front of the class (“Don’t you need a lid for that blender?”), and filtered it. This gave about 120 ml of filtrate. Then I added in 3 tablespoons of dish soap to the filtrate. The soap to breaks down the cell membranes and nuclear membranes because they are made of lipids (fats).

Split pea residue left behind after filtering.

I shared out the resulting green liquid to the four groups. Each student was able to get a fair amount into a test tube so they could complete the lab as individuals.

Disintegrating the cell and nuclear membranes with soap exposed the DNA, but the long DNA molecules tend to be coiled up around proteins. Each student added a pinch (highly quantified I know) of meat tenderizer to their test tube to break down the protein and allow the DNA to uncoil. Enzymes are biological catalysts, large complex molecules that accelerate chemical reactions, the breakdown of proteins in this case, without breaking down themselves, so only a little is needed.

Finally, each student carefully poured rubbing alcohol into the test tube. I had to demonstrate how to tilt the test tube while alcohol was being poured into it so that the alcohol would not mix in with the pea soup but, instead, form a layer at the top, since the alcohol is less dense than the suspension of split peas in salty water.

When the DNA is mixed in with the split pea filtrate (right) it becomes a little harder to distinguish. On the left you can see that the clear rubbing alcohol floats on top of the denser split pea/water/salt mixture.

If it was done carefully enough, the DNA would precipitate at the boundary between the two liquids. If not, the DNA would still precipitate, but it would be mixed in together with the green soup and be harder to distinguish.

Either way, however, students could see the long strands of DNA, and fish them out with glass rods.

Strands of DNA on a glass rod.

Human DNA

The human DNA extraction procedure is well demonstrated by the NOVA video. One student who missed the split pea lab did this experiment instead because it’s faster. It does not require blending to crush the cells, nor does it need the meat tenderizer enzyme.

Although this procedure produces a lot less DNA — after all, you’re only getting a few loose cells from the insides of your cheeks — the strands are still visible. And it’s YOUR DNA.

A few strands of human DNA (belonging to an individual who asked to be referred to as “Suzanne”) in a test tube. The rubbing alcohol is dyed blue for visual contrast.

Since I instructed the class on how to use the microscopes last month, one student wanted to see what his DNA looked like under the microscope. An individual DNA molecule is too small to see, but the strands we have are bunches molecules that are visible. They just don’t look like very much.

DNA strands under the microscope.

Why Diversity is Important

Diversity has been a recurring theme this semester. It started with the diversity conference our middle schoolers attended earlier this year, which, unfortunately, I’m not sure they got a lot out of. As a result, I’ve been making a little bit of a point to bring up the subject when it intersects with our work. This week were were talking about evolution and natural selection, as was able to talk about the practical advantages of both genetic and social diversity.

When the environment changes, species don’t usually have time to adapt. Instead, individuals who already have the genes for beneficial existing traits — traits that work well under the new conditions, like the ability to survive warming climates — will tend to breed more, and over the generations, more and more of the population will have the advantageous trait.

Therefore, to ensure the continuation of the species, we’ll want to have the maximum amount of genetic diversity.

Then I tacked. I asked if anyone was not interested in seeing the continuity of humanity, and the usual wags piped up to say that they could take homo sapiens or leave it. So I showed them the Voluntary Human Extinction Movement website. VHEMT advocates that people voluntarily stop having kids so that humanity eventually will become extinct, restoring the Earth’s environment to a healthy state. Their motto is, “May we live long and die out.”

The class was pretty uniformly aghast.

I particularly like the VHEMT website because it’s really hard to tell if they’re serious or not; which drove my students a little bit crazy. And I eventually got the key question I was angling for, “How could anyone want humans to go extinct?”

My response was, for them at least, quite unsatisfactory, because I chose to answer with a different question: “Do you think that diversity of thought is good?”

For some, their answer was no. However, I then reminded them of that first amendment to the U.S. constitution has to do with freedom of expression, which does seem to suggest that the founders thought diversity of ideas was a good thing. Just like species, countries with greater diversity of ideas are more likely to be able to adapt to changing conditions and succeed.

The application of evolutionary theory to social situations has, historically, been fraught with abuse (see the eugenics movement in particular). I also did not have time to bring the conversation back to why we might want to protect biodiversity. However, this particular lesson gets the point across that diversity has some important practical benefits that might not always be obvious.

Notes

An interview with VHMET on the Discovery Channel:

Semi-artificial Selection?

Just like drug resistant germs (we’ve discussed earlier), the rats are evolving.

“They’ve also mutated genetically and are bred to be immune to standard poisons.

“We have had to start using different methods such as trapping and gassing, which can be less effective and more costly.”

–Graham Chappell, from Rapid Pest Control in Newbury in Rowley (2012): Home counties demand stronger poison to deal with mutant ‘super rats’ in The Telegraph.

Genetics: Tracing the Gypsies back to India

A recent genetic study has confirmed that gypsies (Romani) probably originated in India. Dean Nelson summarizes.

Scientists from Hyderabad’s Centre for Cellular and Molecular Biology collaborated with colleagues in Estonia and Switzerland to compare more than 10,000 samples, including from members of 214 different Indian ethnic groups. They were analysed to match a South Asian Y chromosome type known as “haplogroup H1a1a-M82”, which passes down male bloodlines, with samples from Roma men in Europe.

While there were matches with samples from men throughout the Indian sub-continent, the closest match and the least genetic variation occurred with those from north-west India.

When the researchers overlaid the closest matches onto a genetic map of India, the highest density was in areas dominated by India’s “doma”, “scheduled tribes and castes” – the low caste dalits or untouchables who suffer widespread and generational discrimination and usually do society’s dirtiest jobs.

The researchers believe the descendants of today’s Roma gypsies in Europe began their westward exodus first to fight in wars in what is today Punjab between 1001 and 1026 on the promise of a promotion in caste status.

— Nelson, 2012: European Roma descended from Indian ‘untouchables’, genetic study shows in The Telegraph.

This type of genetic study looks at sections of the DNA sequence, specifically a certain group of genes that is slightly different in people from India compared to everyone else.

A gene is a section of DNA that does a certain job, such as producing a specific protein that results in a certain physical characteristic like eye color. Everyone has the gene for eye color, but some people have a version that gives blue eyes, while others might have a green eye version. The different versions of genes are called alleles, so you can say that some people have the allele for blue eyes while others have the green eye allele. Groups of alleles are passed on from parent to child, which is why children look like their parents, and why different ethnic groups from around the world look different from each other.

So if we take a group genes (call it a haplogroup) and compare the versions characteristic of Indians to those of Gypsies, we can see how similar the two groups are. This study (Gresham et al., 2001) found that Romani and Asians share 45% of the alleles within this haplogroup, which is pretty high. They also looked at another haplogroup in the mitochondrial DNA (mtDNA) that is only passed on from mothers to their children (it’s matrilineal) and found a 26% match.

Making the assumption that mutations in genes occur at a constant rate, the new study estimates that the Roma emigrated out of India somewhere around 1000 years ago.

The relatively recent ages determined for haplogroup VI-68 and M in this study suggest that the ethnogenesis of the Roma can be understood as a profound bottleneck event. Although identification of the parental population of the proto-Roma has to await better understanding of genetic diversity in the Indian subcontinent, our results suggest a limited number of related founders, compatible with a small group of migrants splitting from a distinct caste or tribal group.

–Gresham et al., 2001: Origins and Divergence of the Roma (Gypsies) in The American Journal of Human Genetics.

This is however, not the only evidence of an Indian origin. There are also significant similarities between the Romani and Indian languages that were noted long before. In fact, there is a fascinating, and my modern sensibilities, quite politically incorrect article on the topic of the origin of the Gypsies in the February, 1880 issue of Popular Science Monthly.

Building a Tree of Life (version 2)

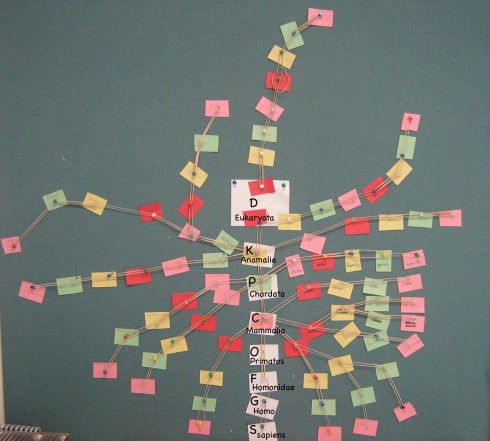
Phylogenetic tree of randomly selected organisms.

I so liked how the tree of life turned out the last time I tried it, that I did it again this year with a significant improvement in the use of rubber bands.

Students chose organisms and then looked up their classification — Wikipedia quite reliable for this — then they wrote the names down on synchronized chips of colored paper. As usual, they preferentially chose charismatic, mammalian, megafauna, but there was also a squid, and for two people who did not come up with anything themselves, I assigned a plant (elm), and a bacteria (the one that causes strep throat).

The actual color pattern of the chips does not matter, but I used red for Domain, yellow for Kingdom, green for Phylum, pink for Class, red for Order, yellow for Family, green for Genus, and pink for species. The colors repeated, and I liked how that helped organize the pattern of the final result.

In class, using a pin-board, I used push pins to place homo sapiens on the board. I linked the push pins with rubber bands, which makes for a nicer, sharper pattern than using string, and is easier to do.

To get a nice pattern I then asked who had the closest relative to humans. It took a little effort to figure it out, but I decided to go with a degrees-of-separation metric. Basically, I asked them to count up the classification system to see how many levels they’d have to go to get to something their species shared with humans. The closest were at the Class level: mammals.

Then, starting with the students with the lowest separation distance, I had the students come up to the board and add their organism to the growing tree.

Later, during lunch, a student asked me what was the difference between bison and buffalo. I didn’t know, but another teacher pointed out that one was from North America and the other from Africa. So I asked two of my middle schoolers to look up the classification of american bison and water-buffalos, which we subsequently added to the tree, and which got me thinking about how we might use the rate of separation of the two continents to figure out how fast genetic variation develops.

Exponential Growth of Cells

Today I grew, and then killed off, a bunch of bacteria using the VAMP exponential growth model to talk about exponential and logarithmic functions in pre-Calculus. I also took the opportunity to use an exponential decay model to talk about the development of drug resistance in bacteria.

Two cells are reproducing (yellow) during a run of the exponential growth model.

Students had already worked on, and presented to each other, a few bacterial growth problems but the sound and the animation helped give a better conceptual understanding of what was going on.

After watching and listening to the simulation I asked, “What happens to the doubling time?” and one student answered, “It gets shorter,” which seems reasonable but is incorrect. I was able to explain that the doubling time stays the same even though the rate of reproduction (the number of new cells per second) increases rapidly.

Graph showing how the number of cells increases over time.
Switching from growth to decay (half-life of 50 sec).

Then I changed the model from growth to decay by changing the doubling time to a half-life. Essentially this changes the coefficient in the exponent of the growth equation from positive to negative. The growth rate’s doubling time was 100 seconds, but I used a half life of 50 seconds for decay to accelerate things a bit, but still show the persistence of the last of the bugs.

Exponential decrease in cell population/biomass.

The cells died really fast in the beginning, and while there was just one cell was left at the very end, it was pretty clear just how persistent that last cell was; cells were dieing so slowly at the end.

This is similar to what happens when someone takes antibiotics. The typical course lasts for 10 days, but you’ve killed enough of the bacteria to loose the symptoms of sickness after two or three. Those final few that remain are the most resistant to the antibiotic, and if you don’t kill them then, once you stop taking the antibiotic, they’ll start to grow and replicate and you’ll end up sick again with a new, antibiotic-resistant population of bacteria.

I thought that using the VAMP model for the demonstration worked very well. The sound of the cells popping up faster and faster with exponential growth seemed to help amplify the visual effect, and make the whole thing more real. And during the decay phase, having that last cell hang on, seemingly forever, really helped convey the idea that bacteria can be extremely persistent.

Buffalo vs. Bisons: Using their Phylogenetic Classification to Estimate the Rate of Evolution

Classification of american bison and water buffalos.

American bison (Bison bison) are native to North America, while water buffalo (Bubalus bubalis) are from Africa. They are different species, and each are classified in a different genus, however, they belong to the same Family, Bovidae. Since it’s highly unlikely that there was any genetic intermingling after Africa separated from North America, if we can figure out how long ago the two continents were together, we can estimate how long ago their common ancestor lived, and how fast evolution occurs (at least in large mammals).

Continental Rifting

North America is moving away from Africa at an average spreading rate of about 2.5 cm/year, and the continents are about 4550 km apart.

To figure out how long it has been since the continents were together, we need to convert the distance into the same units as the spreading rate and then divide by the rate.

Converting the distance to cm:
 \frac{4550 \text{km}}{1} \times \frac{1000\text{m}}{1\text{km}} \times  \frac{100\text{cm}}{1\text{m}}   = 455,000,000 \text{cm}

Finding the time:
 \frac{455,000,000 \text{cm}}{2.5 \text{cm/year}}= 182,000,000 \;\text{years}

So we get 182 million years.

Evolutionary Rates

Now to get really back-of-the-envelope. If it takes 182 million years to be separated by two levels of classification (the genus and species levels), then it takes approximately 91 million years for each level of classification.

If we extend this backwards up the phylogenetic tree (species –> Genus –> Family –> Order –> Class –> Phylum –> Kingdom ), which is probably illegal, we get a grand total of six levels of classification back to the divergence of the plant and animal kingdoms. That’s 546 million years, which is remarkably close to the time of the first fossil records of complex multi-cellular life, somewhere near the beginning of the Cambrian about 540 million years ago.

The major caveat, however, is that the first phylogenetic step, from Domain to Kingdom took a lot longer than our 91 million year average, since the first life appeared on Earth about 4 billion years ago.

Conclusion

There are lots of issues with this analysis, but the result is curiously coincidental. I’d really appreciate any thoughts on the validity of this particular exercise.

Note:

The spreading happens at the Mid-Atlantic Ridge, which bifurcates the Atlantic. However, if you look at a map of the bathymetry of the North Atlantic, you can see long striations — lines — that show the direction of the tectonic plate motion. The distance the continents moved are best measured along this line.