Exponential Cell Growth

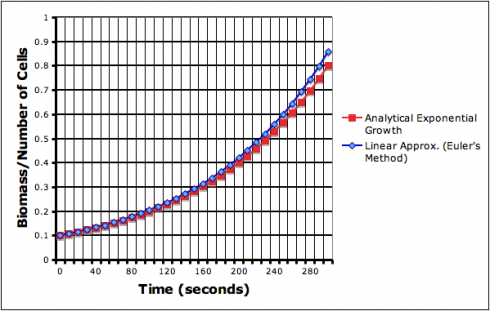
The video shows 300 seconds of purely exponential growth (uninhibited), captured from the exponential growth VAMP scenario. Like the exponential growth function itself, the video starts off slowly then gets a lot more exciting (for a given value of exciting).

The modeled growth is based on the exponential growth function:

 N = N_0 e^{rt} (1)

where:

  • N = number of cells (or concentration of biomass);
  • N0 = the starting number of cells;
  • r = the rate constant, which determines how fast growth occurs; and
  • t = time.

Finding the Rate Constant/Doubling Time (r)

You can enter either the rate constant (r) or the doubling time of the particular organism into the model. Determining the doubling time from the exponential growth equation is a nice exercise for pre-calculus students.

Let’s call the doubling time, td. When the organism doubles from it’s initial concentration the growth equation becomes:

 2N_0 = N_0 e^{r t_d}

divide through by N0:

 2  =  e^{r t_d}

take the natural logs of both sides:

 \ln 2  =  \ln (e^{r t_d})

bring the exponent down (that’s one of the rules of logarithms);

 \ln 2  =  r t_d \ln (e)

remember that ln(e) = 1:

 \ln 2  =  r t_d

and solve for the doubling time:

 \frac{\ln 2}{r}  =  t_d

Decay

A nice follow up would be to solve for the half life given the exponential decay function, which differs from the exponential growth function only by the negative in the exponent:

 N = N_0 e^{-rt}

The UCSD math website has more details about Exponential Growth and Decay.

Finding the Growth Rate

A useful calculus assignment would be to determine the growth rate at any point in time, because that’s what the model actually uses to calculate the growth in cells from timestep to timestep.

The growth rate would be the change in the number of cells with time:

 \frac{dN}{dt}

starting with the exponential growth equation:

 N = N_0 e^{rt}

since we have a natural exponent term, we’ll use the rule for differentiating natural exponents:

 \frac{d}{dx}(e^u) = e^u \frac{du}{dx}

So to make this work we’ll have to define:

 u = rt

which can be differentiated to give:

 \frac{du}{dt} = r

and since N0 is a constant:

 N = N_0 e^{u}

 \frac{dN}{dt} = N_0 e^{u} \frac{du}{dt}

substituting in for u and du/dt gives:

 \frac{dN}{dt} = N_0 e^{rt} (r)

rearranging (to make it look prettier (and clearer)):

 \frac{dN}{dt} = N_0 r e^{rt} (2)

Numerical Methods: Euler’s method

With this formula, the model could use linear approximations — like in Euler’s method — to simulate the growth of the biomass.

First we can discretize the differential so that the change in N and the change in time (t$) take on discrete values:
 \frac{dN}{dt} = \frac{\Delta N}{\Delta t}

Now the change in N is the difference between the current value Nt and the new value Nt+1:

Now using this in our differentiated equation (Eq. 2) gives:

 \frac{N^{t+1}-N^t}{\Delta t} = N_0 r e^{r\Delta t}

Which we can solve for the new biomass (N^t+1):

  N^{t+1}-N^t = N_0 r e^{r\Delta t} \Delta t

to get:
  N^{t+1}     = N_0 r e^{r\Delta t} \Delta t + N^t

This linear approximation, however, does introduce some error.

The approximated exponential growth curve (blue line) deviates from the analytical equation. The deviation compounds itself, getting worse exponentially, as time goes on.

Excel file for graphed data: exponential_growth.xls

VAMP

This is the first, basic but useful product of my summer work on the IMPS website, which is centered on the VAMP biochemical model. The VAMP model is, as of this moment, still in it’s alpha stage of development — it’s not terribly user-friendly and is fairly limited in scope — but is improving rapidly.

In Space Without a Spacesuit? 90 Seconds in the Vacuum

10 seconds of consciousness, and 90 seconds for “minimal permanent injury”. Andrew Tarantola summarizes the actual science of What Really Happens When You Get Sucked Out of an Airlock.

Some degree of consciousness will probably be retained for 9 to 11 seconds (see chapter 2 under Hypoxia). In rapid sequence thereafter, paralysis will be followed by generalized convulsions and paralysis once again. During this time, water vapor will form rapidly in the soft tissues and somewhat less rapidly in the venous blood. This evolution of water vapor will cause marked swelling of the body to perhaps twice its normal volume unless it is restrained by a pressure suit.

— Parker and West (1973): Bioastronautics Data Book: Second Edition. NASA SP-3006.

The Dish

This is a question I occasionally get from students, so it’s good know where to find the studies, even though much of the evidence comes from accidents that happened to astronauts and cosmonauts.

The Geology of Oil Traps Activity

The following are my notes for the exercise that resulted in the Oil Traps and Deltas in the Sandbox post.

Trapping Oil

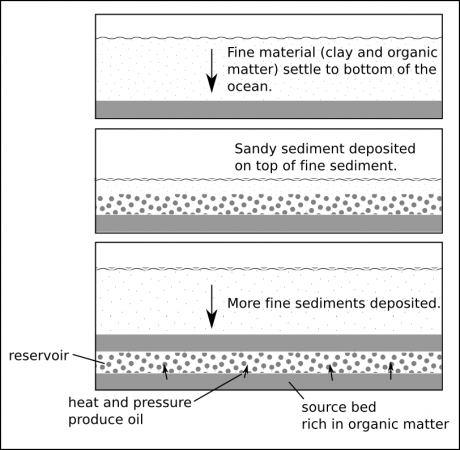
Crude oil is extracted from layers of sand that can be deep beneath the land surface, but it was not created there. Oil comes from organic material, dead plants and animals, that sink to the bottom of the ocean or large lakes. Since organic material is not very dense, it only reaches the bottom of ocean in calm places where there are not a lot of currents or waves that can mix it back into the water. In these calm places, other very small particles like clay can also settle down.

Figure 1. Formation of sandstone (reservoir) and shale (source bed).

Over time, millions of years, this material gets buried beneath other sediments, compressing it and heating it up. Together the organic material and the clay form a type of sedimentary rock called shale. As the shale gets buried deeper and deeper and it gets hotter and hotter, and the organic matter gets cooked which causes it to release the chemical we know as natural gas (methane) and the mixture of organic chemicals we call crude oil (see the formation of oil and natural gas).

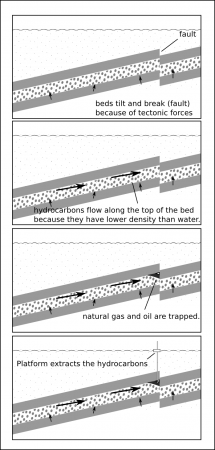
Figure 2. The trapping of oil and natural gas by a fault.

Shale beds tend to be pretty tightly packed, and they slowly release the oil and natural gas into the layers of sediment around them. If these layers are made of sandstone, where there is much more space for fluids to move between the grains of sand, the hydrocarbons will flow along the beds until they are trapped (Figure 2).

In this exercise, we will use the wave tank to simulate the formation of the geologic layers that produce oil.

Materials

  • Wave tank
  • Play sand (10x 20kg bags)
  • Colored sand (2 bags)

Observations

For your observations, you will sketch what happens to the delta in the tank every time something significant changes.

Procedure

  1. Fill the upper half of the tank with sand leaving the lower half empty.
  2. Fill the empty part with water until it starts to overflow at the lower outlet.
  3. Move the hose to the higher end so that it creates a stream and washes sand down to the bottom end — observe the formation of the delta.
  4. Observe how the delta builds out (progrades) into the water.
  5. After about 10 minutes dump the colored sand into the stream and let it be transported onto the delta.
  6. After most of the colored sand has been transported, raise the outlet so that the water level in the tank rises to the higher level. — Note how the delta forms at a new place.
  7. After about 10 more minutes dump another set of colored sand and allow it to be deposited on the delta.
  8. Now lower the outlet to the original, low level and observe what happens.
  9. After about 10 minutes, turn off the hose and drain all of the water from the tank.
  10. When the tank is dry, use the shovel to excavate a trench down the middle of the sand tank to expose the cross-section of the delta.

Analysis

1. How did changing the water level affect the formation of the delta.

-
-
-
-
-
-

2. When you excavated the trench, did you observe the layers of different colored sand in the delta? Draw a diagram showing what you observed. Describe what you observed here.

-
-
-
-
-
-

3. Was this a realistic simulation of the way oil reservoirs are formed. Please describe all of the things you think are accurate, and all of the things you think are not realistic?

-
-
-
-
-
-

The Formation of Oil and Natural Gas

When organic material is buried it is compressed and “cooked” because the deeper you go beneath the surface of the earth the hotter it gets. This causes the breakdown of the organic matter and the production natural gas and oil. The stages of decomposition are:

Diagenesis:

  • Decomposition of biological material produces methane gas. At slightly higher temperatures and pressures the organic matter is converted to kerogen – an unorganized (amorphous) material of carbon, hydrogen, and oxygen.

Catagenesis:

  • At higher temperatures and pressures kerogen is altered and the majority of crude oil is formed. During this phase and the next, the larger molecules break down into simpler molecules such as octane and propane (a process called cracking).

Metagenesis:

  • In the final stage of alteration (at higher temperatures and pressures) of kerogen and crude oil, natural gas (mostly methane) is produced and residual carbon is left in the source rock.

Bending a Soccer Ball

Students from the University of Leicester have published a beautiful short research paper (pdf) on the physics of curving a soccer ball through the air.

It has been found that the amount a football bends depends linearly on the speed of the ball and the amount of spin.

— Sandhu et al., 2011: How to score a goal (pdf) in the University of Leicester’s Journal of Physics Special Topics

They derive the relationship from Bernoulli’s equation using some pretty straightforward algebra. The force (F) perpendicular to the ball’s motion that causes it to curl is:

F = 2 \pi R^3 \rho \omega v

and the distance the ball curls can be calculated from:

D = \frac{\pi R^3 \rho \omega}{ v m } x^2

where:

  • F = force perpendicular to the direction the ball is kicked
  • D = perpendicular distance the ball moves to the direction it is kicked (the amount of curl)
  • R = radius of the ball
  • ρ = density of the air
  • ω = angular velocity of the ball
  • v = velocity of the ball (in the direction it is kicked)
  • m = mass of the ball
  • x = distance traveled in the direction the ball is kicked

The paper itself is an excellent example of what a short, student research paper should look like. And there are number of neat followup projects that advanced, high-school, physics/calculus students could take on, such as: considering the vertical dimension — how much time it take for the ball to rise and fall over the wall; creating a model (VPython) of the motion of the ball; and adding in the slowing of the ball due to air friction.

ScienceDaily