Consider just how effectively this octopus camouflages itself.
Category: Natural World
And a Comet Hits the Sun

SOHO scientists think that coronal mass ejection that happens right after the comet hits the Sun was probably not caused by the collision. But it looks really cool.
SOHO has a nice glossary of terms for understanding the Sun that’s specifically for middle school students (there is also a more general one). They also have some much higher quality video.
The Search for Extraterrestrial Life Slows Down

SETI has been forced to put its Allen Telescope Array into hibernation due to lack of funding. Its a sad day for exploration of the cosmos. They’re asking for help from the public to keep going.
Social Action: Extracting Potable Water from the Air
Shreerang Chhatre is working on a mesh that captures droplets of fog from the air to provide water in places where drinkable water is hard to get.
Chhatre is working on this at MIT which has some interesting programs for people interested in social action. He’s in the Chemical Engineering program but works with their Legatum Center for Development and Entrepreneurship.
Weather versus Climate: The Seasonal Migration of the Sub-Polar Low
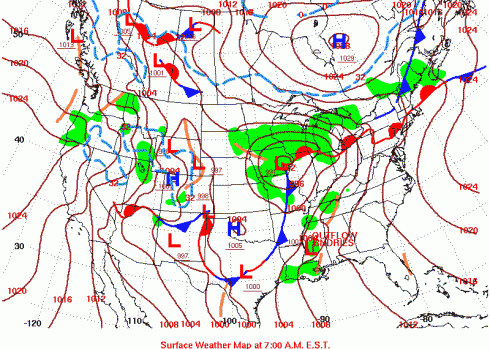
The cold fronts of mid-latitude cyclones bring thunderstorms, rain and spawn tornadoes like the ones we’ve seen over the last few days. In the spring and fall, these cyclones just sweep across the southern U.S. again and again. The line of their passage sort-of marks the northward migration of the sub-polar low in picture of the global atmospheric circulation system.
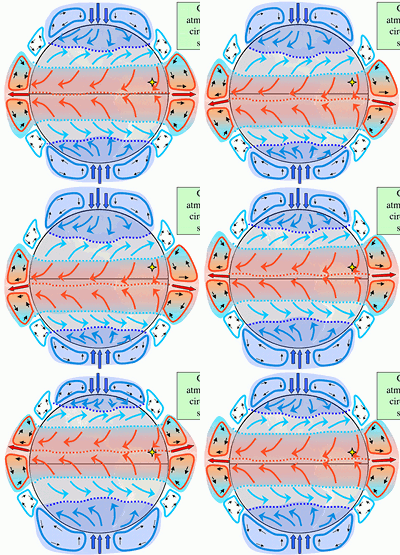
Each individual front, with its storms, is a feature of the weather. Climate, on the other hand, is the result of the average position over time: the series of fronts which make the southern U.S. wet in the spring and fall.
The sub-polar low is not the only feature that brings lots of seasonal rain. The ITCZ does also, and the rains that the ITCZ’s movement north and south of the equator bring, are what we call the monsoons. The yellow star on the animation, just to the north of the equator, sees monsoonal rains in the summer. Since the ITCZ follows the sun with the seasons, the monsoons always come in the summer; even in the southern hemisphere.
Global Warming and Changing Ecological Niches
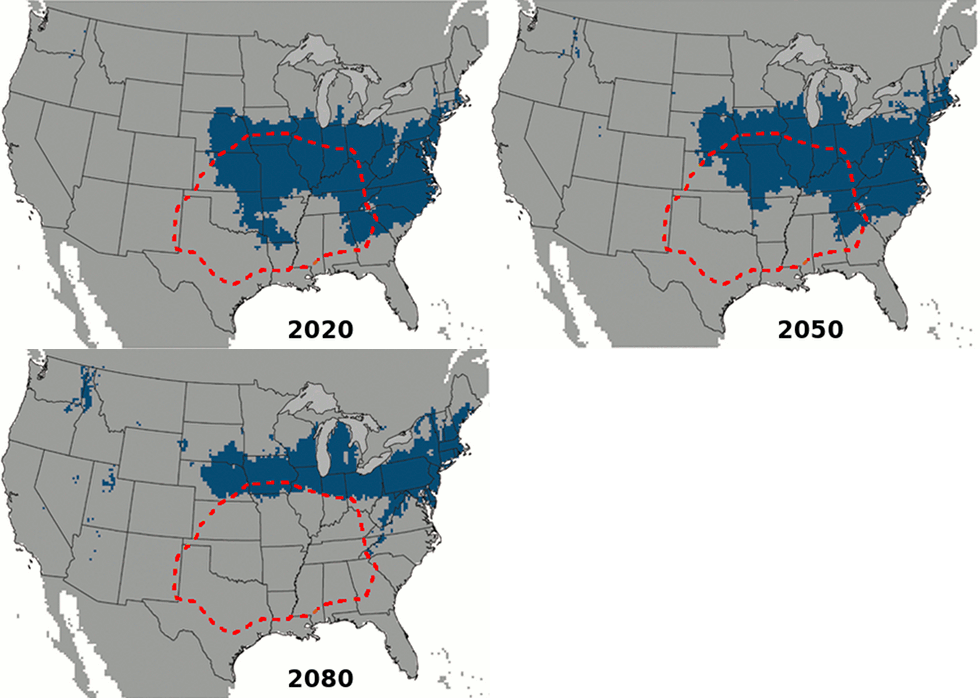
Just in time for us to learn about global change, this interesting study on the expanding range of brown recluse spiders came out. Once restricted to the southern U.S. and the midwest, future climate change will allow them to expand north to Minnesota and east into Pennsylvania.
The researchers, Saupe et al. (2011), used ecological niche modeling. This method takes known information about where the spiders live, such as climate (e.g. summer temperatures) or topography (e.g. mountains versus plains), to figure out the current extent of their ecological niche. Then they use climate models to figure out where those same conditions will apply in the future. Thus the spiders march north.
Parting the Red Sea: Biblical Scenes from Space and Computer Modeling on the Earth
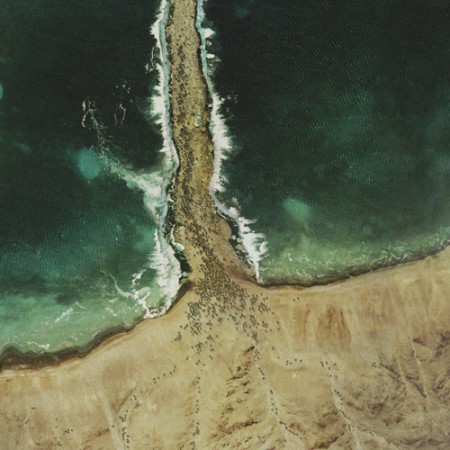
The Glue Society has a most interesting set of satellite images modified to look like major biblical scenes. CreativeReview has more pictures and details, including of the crucifixion and Noah’s Ark.
“We like to disorientate audiences a little with all our work. And with this piece we felt technology now allows events which may or may not have happened to be visualized and made to appear dramatically real,” say The Glue Society’s James Dive. “As a method of representation satellite photography is so trusted, it has been interesting to mess with that trust.”
— CreativeReview (2007): The Bible According To Google Earth
I think this topic came up when we were talking about atmospheric circulation. The question was about if the winds generated descending, diverging air could have parted the Red Sea. The answer was no, because the general atmospheric circulation system is a thing of climate — averages of the weather — while any winds strong enough to part the red sea would be actual weather, like the storms we seem to have been seeing every day for the last few weeks.
Oddly enough, just last year researchers from the University Corporation for Atmospheric Research (UCAR) did a computer model that showed that hurricane force winds from the northwest could have uncovered an underwater reef to allow Moses his passage (the article is Drews and Han, 2010).
However, the scientists found:
[The] reef would have had to be entirely flat for the water to drain off in 12 hours. A more realistic reef with lower and deeper sections would have retained channels that would have been difficult to wade through. In addition, Drews and Han were skeptical that refugees could have crossed during nearly hurricane-force winds.
— NCAR & UCAR News Center (2010): Parting the waters: Computer modeling applies physics to Red Sea escape route.
NPR’s article on the topic is worth a listen.
Global Warming: Yes, it’s Warming
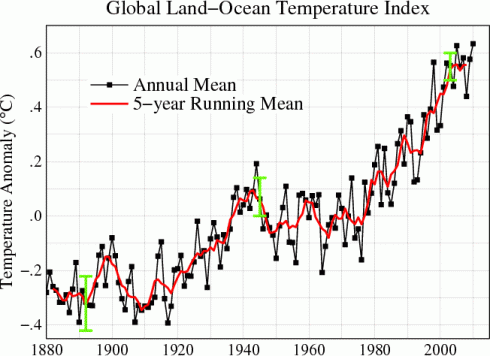
NASA’s Goddard Institute for Space Science has an excellent page that is updated every month, which shows graphs of global temperature changes.
IN addition to the global graphs, there are a lot of really neat graphs showing:
- separate graphs from the tropics versus the northern hemisphere versus the southern hemisphere (the different latitude bands);
- the difference between the northern and southern hemispheres;
- the U.S. only;
- seasonal changes.
The graphs typically show the temperature anomaly, which is the difference in temperature from the normal. The “normal” is taken to be the average temperature between 1951 and 1980.