The character of an individual, and even of a people, is best identified in periods of adversity. That was one of the things that came up when my students discussed ethics, morality and poverty. With all the talk of how the Japanese people are reacting to last week’s earthquake, with a relative lack of looting and criminality, it is worth visiting Jesse Walker’s article in Reason last year that really looked at how people really respond to disasters. It turns out, that from Haiti to New Orleans to San Fransisco in 1906, people are much more restrained and disciplined than we’re lead to imagine.
Walker also points out the incongruity between our expectations and actual observations:
It isn’t unusual for a TV reporter to get his facts wrong. It’s rarer for the images that accompany his dispatch to flagrantly contradict what he says. But on January 21, broadcasting in the aftermath of the earthquake that devastated Haiti, CNN correspondent Ivan Watson fretted about “chaotic crowds” as the camera showed people who were calm and patient. When Watson announced that we were watching a “chaotic scramble” onto a rescue ship, this was illustrated by a group of refugees carefully, methodically passing a baby onto the boat.
The Economist has come up with a neat little flash app that combines all the ingredients to see which Arab countries are ripest for revolution. They call it their “Shoe Thrower’s Index”.
We’ve seen how a combination of demographics (lots of young people), an educated middle class, and protests might lead to revolutions (which still often come as a surprise). With The Economist’s table you get to choose which factors you think are most important.
Move the slider bars on the right to set the “weight” of each indicator of revolution to what you think is most important, and the chart on the left will adjust itself to show which countries are more likely to have a revolution based on your parameters.
OK. For someone like me this map is just ridiculously addictive. Produced by Revolver Maps, it shows the locations of everyone who’s visited the Muddle since March 5th (2011). If you click on the map it will take you to their page where you can find out more about the locations of all those dots.
The points on the map are a fascinating result of a combination of population distribution, language, technologic infrastructure (and wealth), and the miscellaneous topics on which I post.
Hits on the Muddle (blue circles) after two days, overlayed on a population density map of the U.S.. (Population density map from the USDA).
Overlaying at the location of hits after two days, on a population density map of the U.S. shows the obvious: the more people there are, the more likely it is that someone would stumble upon my blog. The eastern half of the U.S. with its higher populations are well represented, as is the west coast, while the hits in between come from the major population centers.
The pattern of hits from Australia shows very precisely that the major population centers are along the coast and not in the arid interior.
Map showing the hits on the Muddle (March 5-7) from Africa versus population density.
Africa, however, tells a much different story. The large population centers are along the equatorial belt of sub-Saharan Africa. But even now, there are very few if any hits from that region. I suspect that’s largely because of language and lack of access to the internet. The Muddle is not exactly the most popular on the internet, so it probably takes a lot of people on computers for a few to find their way to it. Contrast sub-Saharan Africa to South Africa, which is relatively wealthy, uses English as its lingua franca (working language), and has seen at least a few people hit the Muddle.
Members of the Commonwealth of Nations. Most of these countries were once part of the British Empire. (Image from Wikimedia Commons User:Applysense.)
Language also plays in big role in the pattern of hits from Europe and Asia. There are many English speakers in western Europe, a very high population density, and so a lot of hits, but the British Isles, as might be expected, are particularly well represented. Similarly in Asia, the members of the Commonwealth are show up disproportionately.
From the middle east, there have been a several hits from the wealthy small states like Bahrain and Qatar, but also a number from Egypt. The Egyptian interest in particular seems to stem from my posts on the recent revolution. No-one from that part of the world has commented on any of it so far, so I have no idea if they find the posts positive, negative, indifferent or whatever. I’d be curious to find out, since even negative feedback is important.
On the note of current events, my post on the plate tectonics of the earthquake in Japan has engendered quite a number of hits, and some positive feedback in the comments section and via email (one from a Japanese reader). In the week since the earthquake more than half the hits to the Muddle have been to that post, largely because it’s been popping up on the front page of the Google search for “plate tectonics earthquake Japan”.
Recent visitors to the Muddle on March 15th, 5:00 AM.
It has been fascinating seeing people from so many different countries hitting my blog. Since most don’t comment, or drop me a note, blogging often feels quite lonely, like I’m just talking to myself. Self-reflection was the original purpose for this blog, and I find that combining writing and graphics really works for me as a way of expressing myself.
Yet, this blog would not be public if I did not have an insatiable urge to share. So thanks for reading, and don’t be afraid to comment. I am a Montessori middle school teacher after all, so I tend not to bite. Although, if you do try to post a comment and it doesn’t show up it may be because it got caught in my spam filter; there is a 1000:1 ratio of spam to legitimate comments so it’s hard for me to catch any mistakes. Sending me an email should fix that though.
Volcanos and convergent margins go together. Typically, the plate being subducted melts as it is pushed deeper into the Earth and temperatures rise. It also helps that the water in the crust and sediment of the subducting plate makes it easier to melt, and makes the resulting magma much more volatile and explosive.
The subducting plate melts producing volatile magma.
But although Shinmoedake is in Japan, it is not on the same tectonic boundary as the earthquake. The northern parts of Japan are where the Pacific Plate is being subducted beneath the Okhotsk Plate. This volcano is connected to the subduction of the Philippine Plate to the south.
The large earthquake's epicenter and the Shinmoedake volcano are on different plate margins. Image adapted from Wikimedia Commonsuser Sting.
This does not necessarily mean that the two occurrences are totally unrelated. Seismic waves from the big earthquake could have been enough to incite magma chambers that were just about ready to blow anyway.
The map below is centered on the series of craters in the region of the erupting volcano.
The tsunami spawned by the recent earthquake off Japan did most of the damage we know about so far. The U.S. National Oceanic and Atmospheric Administration’s Center for Tsunami Research uses computer models to forecast, and provide warnings about, incoming tsunami waves. They have an amazing simulation showing the propagation of the recent tsunami across the Pacific Ocean (the YouTube version is here).
Images captured from the NOAA simulation. The full resolution, 47Mb video can be found here, on NOAA's site.
They’ve also posted an amazing graphic showing the wave heights in the Pacific Ocean.
Tsunami wave heights modeled by NOAA. Note the colors only go up to 2 meters. The maximum wave heights (shown in black in this image), near the earthquake epicenter, were over 6 meters.
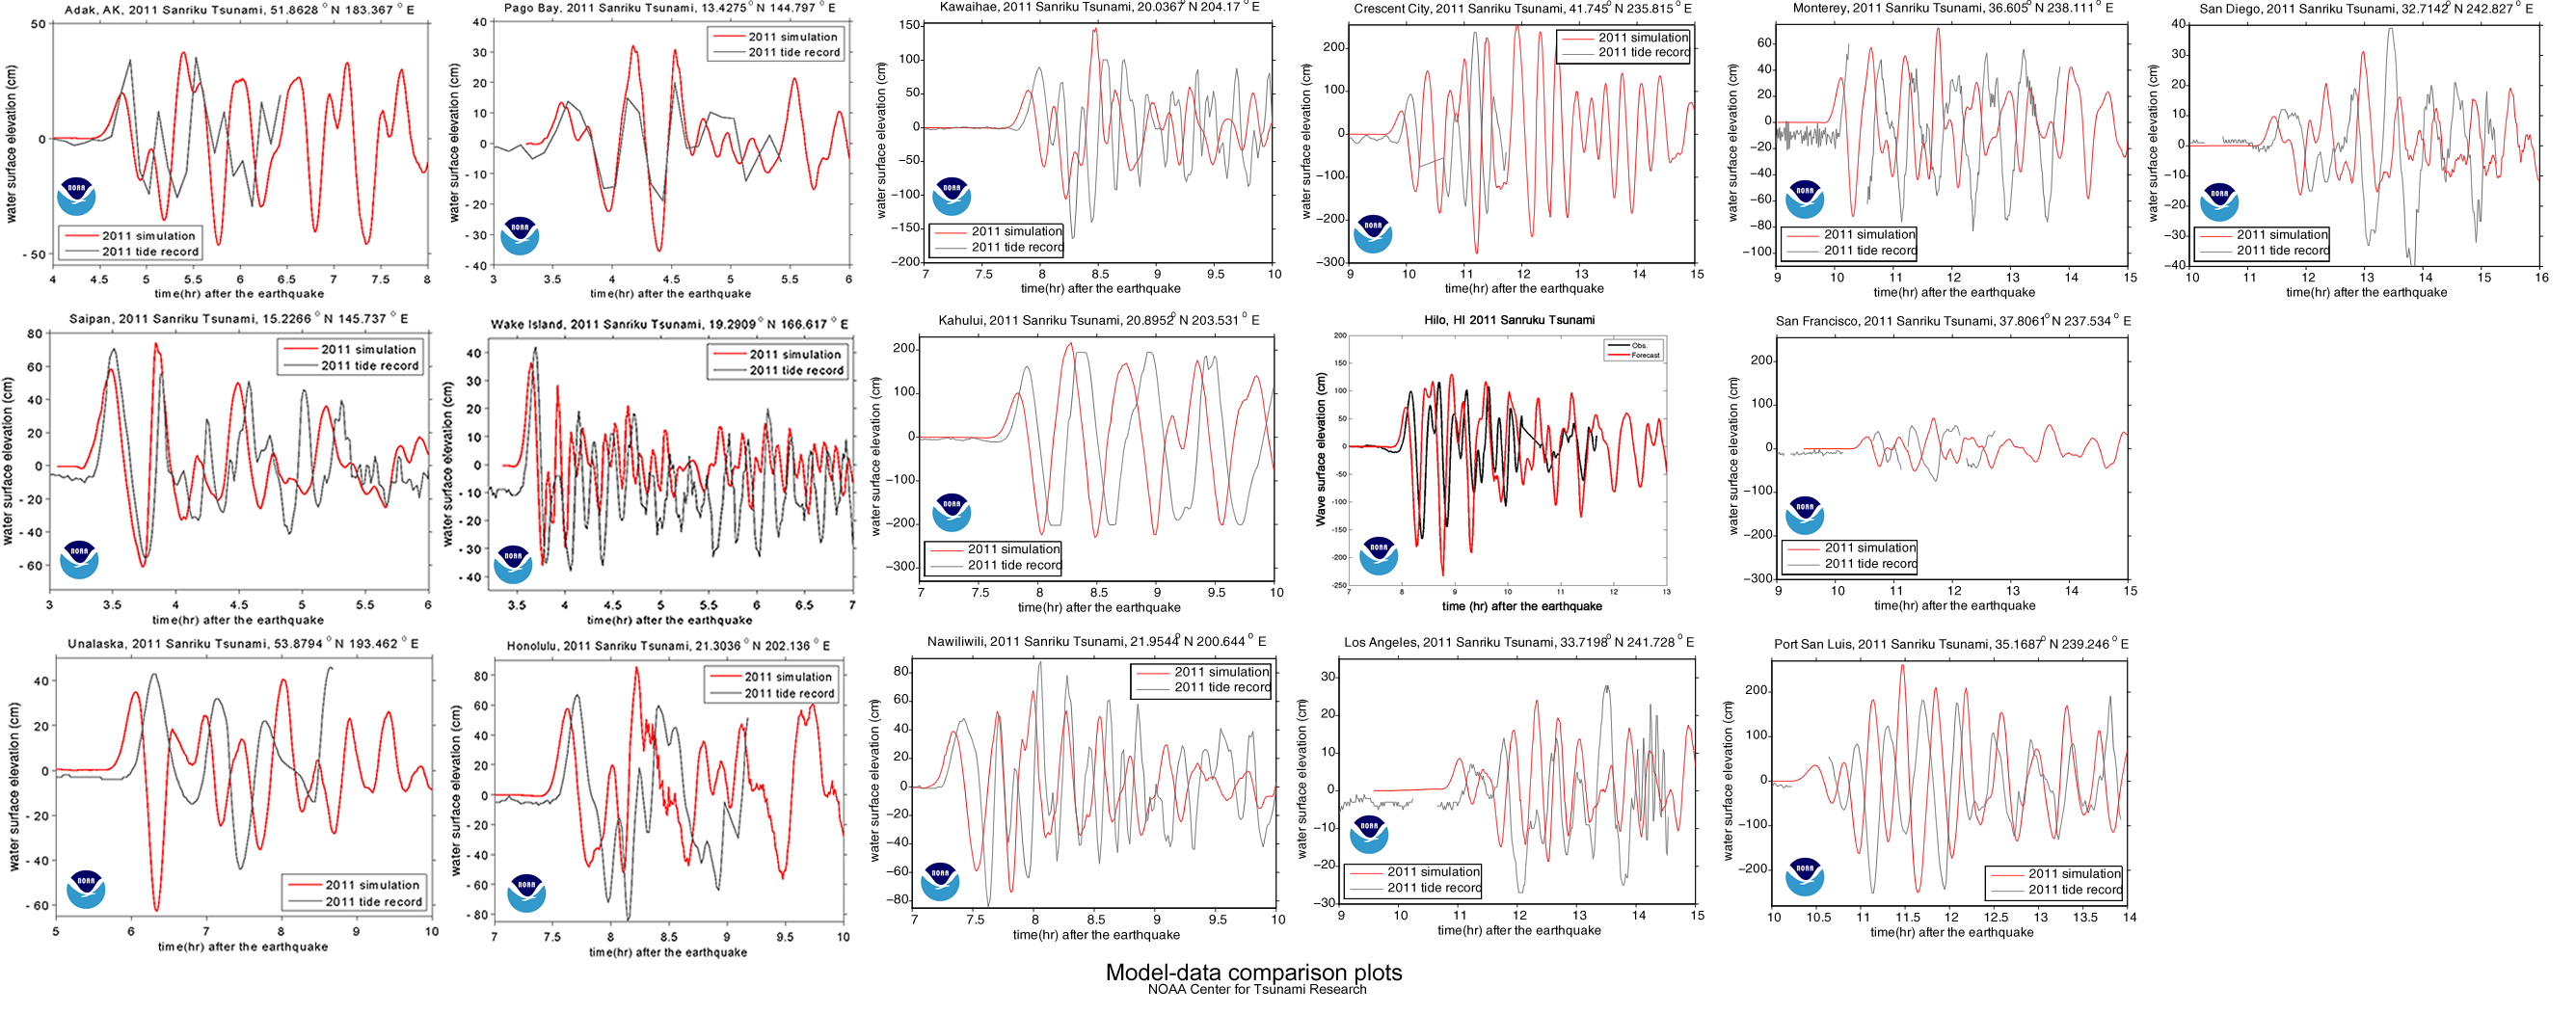
Of course, these are the results of computer simulations. As scientists, the people at NOAA who put together these plots are always trying to improve. Science involves a continuous series of refinements to better understand the world we live in, so the NOAA scientists compare their models to what really happen so they can learn something and do better in the future. Perhaps the best way to do this for the tsunami is by comparing the predictions of their models to the actual water height measured by tidal gages:
The red line is the tsunami's water height predicted by the NOAA computer models for Honolulu, Hawaii, while the black line is the actual water height, measured at a tidal gauge. Other comparisons can be found here.
You’ll notice that NOAA did not do a perfect job. They did get the amplitude (height) of the waves mostly right, but their timing was a little off. Since it’s about 6000 km from the earthquake epicenter to Honolulu, being off by a few minutes is no mean feat. Yet I’ll bet they’re still working on making it better, particularly since some of the other comparisons were not quite as good.
… a tsunami wave approaching land is more like a wall of whitewater. …. Since the wave is 100 miles long and the tail end of the wave is still traveling at 500 mph, the shore end of the wave becomes extremely thick, and is forced to run far inland, over streets and trees and houses. …. And remember, the water isn’t clean, but filled with everything dredged up from the sea floor and the land the wave runs over–garbage, parking meters, pieces of buildings, dead animals.
Nuclear disasters are so rare that they’re easy to forget about when we’re talking about the right mix of alternative (non-carbon based) energy sources for the future.
Right after the accidents at Three Mile Island in 1979 and Chernobyl in 1986, awareness of the dangers lead to a de facto moratorium on nuclear power plants in the U.S.. This was good in that people were now treating nuclear power much more respectfully, and incorporating the costs of potential accidents into their calculations. However, it also reduced the interest and effort of developing newer and safer types of nuclear plants.
We’ll have this discussion next year when we focus more on the physical sciences.
The magnitude 8.9 earthquake that devastated coastal areas in Japan shows up very clearly on the United States Geologic Survey’s recent earthquake page.
The big red square marks an aftershock of the magnitude 8.9 earthquake off Japan. (Image via USGS). Note that most of the earthquakes occur around the edge of the Pacific Ocean (and the Pacific Plate).
Based on our studies of plate tectonics, we can see why Japan is so prone to earthquakes, and we can also see why the earthquake occurred exactly where it did.
The obvious trench to the east and the mountains and volcanoes of the Japanese islands indicate that this is a convergent margin. The Pacific plate is moving westward and being subducted beneath the northern part of Japan, which is on the Okhotsk Plate.
The tectonic plates and their boundaries surrounding Japan. The epicenter of the earthquake is along the convergent margin where the Pacific Plate is being subducted beneath the Okhotsk Plate. Image adapted from Wikimedia Commonsuser Sting.
The epicenter of the earthquake is on the offshore shelf, and not in the trench. Earthquakes are caused by breaking and movement of rocks along the faultline where the two plates collide.
In cross-section the convergent margin would look something like this:
Diagram showing the tectonic plate movement beneath Japan. Note the location of the earthquake is beneath the offshore shelf and not in the trench.
The shaking of the sea-floor from the earthquake creates the tsunamis.
So where are there similar tectonic environments (convergent margins)? You can use the Google Map above to identify trenches and mountain ranges around the world that indicate converging plates, or Wikimedia Commonsuser Sting’s very detailed map, which I’ve taken the liberty of highlighting the convergent margins (the blue lines with teeth are standard geologists’ markings for faults and, in this case, show the direction of subduction):
Convergent plate boundaries (highlighted blue lines) shown on a world map of tectonic boundaries. The blue lines with teeth are standard geologic symbols for faults, with the teeth showing the direction of the fault underground. Image adapted from Wikimedia Commonsuser Sting.
The Daily Dish has a good collection of media relating to the effects of the quake, including footage of the tsunami inundating coastal areas.
Cars being washed away along city streets:
Our thoughts remain with the people of Japan.
UPDATES:
1. Alan Taylor has collected some poignant pictures of the flooding and fires caused by the tsunami and earthquake. TotallyCoolPix has two pages dedicated to the tsunami so far (here and here).
2. Emily Rauhala summarizes Japan’s history of preparing for this type of disaster. They’ve done a lot.
3. Mar 12, 2011. 2:10 GMT: I’ve updated the post to add the map of the tectonic plates surrounding Japan.
4. A CNN interview that includes video of the explosion at the Fukushima nuclear power plant (my full post here).
5. NOAA has an amazing image showing the tsunami wave heights.
Tsunami wave heights modeled by NOAA. Note the colors only go up to 2 meters. The maximum wave heights (shown in black in this image), near the earthquake epicenter, were over 6 meters.
They also have an excellent animation showing the tsunami moving across the Pacific Ocean. (My post with more details here).
6. The United States Geological Survey (USGS) put out a podcast on the day of the earthquake that has interviews with two specialists knowledgeable about the earthquake and the subsequent tsunami, respectively. Over 250 kilometers of coastline moved in the earthquake which is why the tsunami was so big. They also have a shakemap, that shows the area affected by the earthquake.
USGS ShakeMap for the earthquake. Image via the USGS.
9. A detailed article on earthquake warning systems, among which, “Japan’s system is among the most advanced”, was recently posted in Scientific American.
10. Mar 15, 2011. 9:15 GMT: I’ve added a map of tectonic boundaries highlighting convergent margins.
Shinmoedake Volcano.
11. The Shinmoedake Volcano erupted two days after the earthquake, but they may be unrelated.
Fukushima reactor status as of March 16th, 5:00 pm GMT from the Guardian live blog.
12. The Guardian’s live blog has good, up-to-date information on the status of the nuclear reactors at Fukushima.
Shackelton’s Antarctic expedition remains one of the most ridiculously epic adventures I have ever encoutered. Through excellent leadership, and remarkable feats of navigation, every member of the expedition survived the destruction of their ship, The Endurance, and made their way across the harshest landscapes and oceans to find safety.
Sir Ernest Shackleton scouting the way across the Antarctic ice.
How to be a Retronaut has posted the color pictures taken by Frank Hurley, the expedition’s photographer.
According to the State Library of New South Wales, after their ship had become irretrievably stuck in the ice:
Hurley managed to salvage the photographic plates by diving into mushy ice-water inside the sinking ship in October 1915.
This is kind of emblematic of the dedication of the explorers on this expedition. There’s so much for middle-schoolers to learn about dealing with hardship and immense adversity. I strongly recommend the book, but little anecdotes like this one continue to impress.


