A wonderful and facinating interpretation of what pi sounds like if you translate the first 33 digits into sounds.
Category: video
Nuclear Meltdown in Japan
CNN has an informative interview on the explosion at the Fukushima nuclear plant in Japan after the earthquake and tsunami.
Footage of the explosion from the BBC:
Nuclear disasters are so rare that they’re easy to forget about when we’re talking about the right mix of alternative (non-carbon based) energy sources for the future.
Right after the accidents at Three Mile Island in 1979 and Chernobyl in 1986, awareness of the dangers lead to a de facto moratorium on nuclear power plants in the U.S.. This was good in that people were now treating nuclear power much more respectfully, and incorporating the costs of potential accidents into their calculations. However, it also reduced the interest and effort of developing newer and safer types of nuclear plants.
We’ll have this discussion next year when we focus more on the physical sciences.
UPDATE:
1. More details on how nuclear plants work can be found in Maggie Koerth-Baker’s post, Nuclear energy 101: Inside the “black box” of power plants.
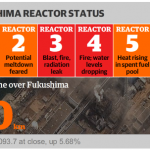
2. The Guardian’s live blog has good, up-to-date information on the status of the nuclear reactors at Fukushima.
Erosion in action
With a little help to get started, the water erodes a channel, transporting sediment to the ocean.
For what it’s worth (and it seems a reasonable explanation to me):
The beach sits at the base of a valley which has a small stream running through it. Due to wave action, sand gets pushed up into a large hill in front of the stream each winter. This creates a natural dam that the stream water collects behind for months which is about 20 feet above the level of the ocean on the other side of the sand berm. Every year some one digs a trench through the sand releasing millions of gallons of fresh water into the ocean.
– YouTube User:Hackfleischhasser comments on the video Waimea River
Plate Tectonics and the Earthquake in Japan
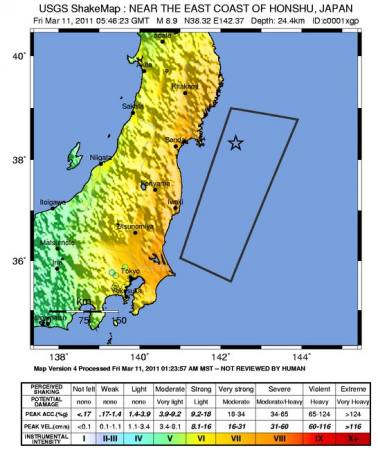
The magnitude 8.9 earthquake that devastated coastal areas in Japan shows up very clearly on the United States Geologic Survey’s recent earthquake page.
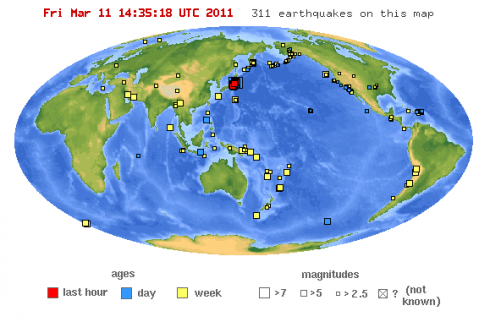
Based on our studies of plate tectonics, we can see why Japan is so prone to earthquakes, and we can also see why the earthquake occurred exactly where it did.
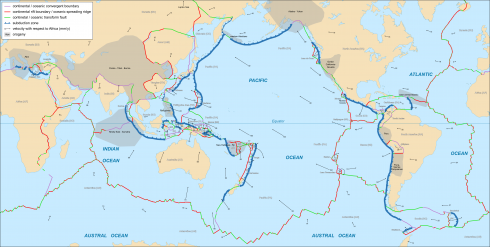
The obvious trench to the east and the mountains and volcanoes of the Japanese islands indicate that this is a convergent margin. The Pacific plate is moving westward and being subducted beneath the northern part of Japan, which is on the Okhotsk Plate.
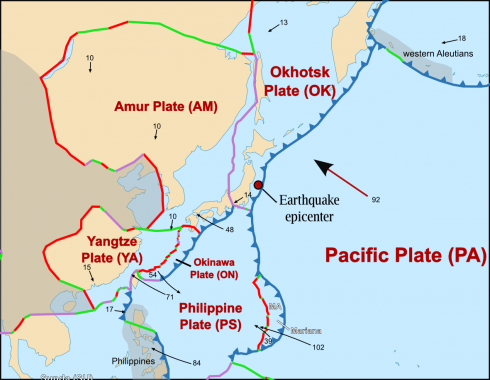
The epicenter of the earthquake is on the offshore shelf, and not in the trench. Earthquakes are caused by breaking and movement of rocks along the faultline where the two plates collide.
In cross-section the convergent margin would look something like this:
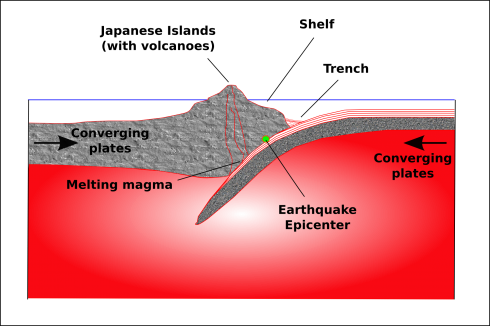
The shaking of the sea-floor from the earthquake creates the tsunamis.
So where are there similar tectonic environments (convergent margins)? You can use the Google Map above to identify trenches and mountain ranges around the world that indicate converging plates, or Wikimedia Commons user Sting’s very detailed map, which I’ve taken the liberty of highlighting the convergent margins (the blue lines with teeth are standard geologists’ markings for faults and, in this case, show the direction of subduction):
The Daily Dish has a good collection of media relating to the effects of the quake, including footage of the tsunami inundating coastal areas.
Cars being washed away along city streets:
Our thoughts remain with the people of Japan.
UPDATES:
1. Alan Taylor has collected some poignant pictures of the flooding and fires caused by the tsunami and earthquake. TotallyCoolPix has two pages dedicated to the tsunami so far (here and here).
2. Emily Rauhala summarizes Japan’s history of preparing for this type of disaster. They’ve done a lot.
3. Mar 12, 2011. 2:10 GMT: I’ve updated the post to add the map of the tectonic plates surrounding Japan.
4. A CNN interview that includes video of the explosion at the Fukushima nuclear power plant (my full post here).
5. NOAA has an amazing image showing the tsunami wave heights.
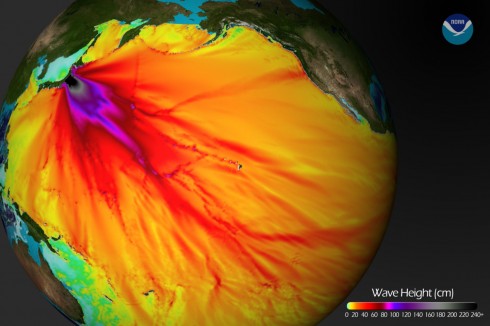
They also have an excellent animation showing the tsunami moving across the Pacific Ocean. (My post with more details here).
6. The United States Geological Survey (USGS) put out a podcast on the day of the earthquake that has interviews with two specialists knowledgeable about the earthquake and the subsequent tsunami, respectively. Over 250 kilometers of coastline moved in the earthquake which is why the tsunami was so big. They also have a shakemap, that shows the area affected by the earthquake.
7. ABC News (Australia) and Google have before and after pictures.
8. The University of Hawaii has a page about, Why you can’t surf a tsunami.
9. A detailed article on earthquake warning systems, among which, “Japan’s system is among the most advanced”, was recently posted in Scientific American.
10. Mar 15, 2011. 9:15 GMT: I’ve added a map of tectonic boundaries highlighting convergent margins.
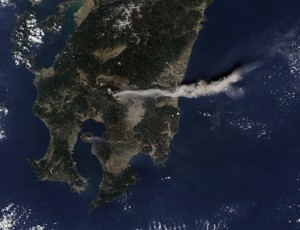
11. The Shinmoedake Volcano erupted two days after the earthquake, but they may be unrelated.

12. The Guardian’s live blog has good, up-to-date information on the status of the nuclear reactors at Fukushima.
Keynes and Hayek
I used my notes and the Keynes versus Hayek music video as part of our reading this week. As usual, half the class tried skipping directly to the video, but it became pretty clear, as I suspected it would, that they didn’t understand what was going on if they had not read the notes.
We’ll be discussing the video tomorrow when we try to wrap up the week’s work, but, as one student mentioned, it can be a little hard to figure out the words in the rap. Fortunately, the Econ Stories website has been updated to include the lyrics.
Even without the lyrics, however, I really like that you can get a good idea about the competing economic theories solely from the video itself, since it’s just a very detailed extended metaphor. It’s so chock full of symbols that it could probably be used to supplement the Calvin and Hobbes comic strip in our language lessons on finding symbols in texts.
How protests lead to revolution
The events that spark revolutions can come as a surprise. While everyone at home might want to overthrow the dictator, they don’t know if everyone else wants to do so too, so they are reluctant to go against the government. This is why protests are so important (as well as news coverage of the protests), because then the people offended by the government can see that there are a lot of other people like them.
Dictators, like Mubarak, do a lot to prevent protests: their secret police will arrest and “disappear” opposition leaders; riot police will be out in force to suppress protests if people start to gather.
The Egyptian protesters faced this very problem. So they organized over the internet, as anonymously as possible, and, for the January 25th protests, they arranged several meeting places for protesters so the riot police were too spread out to suppress everyone.
Stephen Pinker talks about this in terms of Individual Knowledge and Mutual Knowledge. Individually everyone knows the dictator is bad, but with the protests, they all realize, mutually, that everyone else also thinks the dictator is bad. Which is really bad for the dictator.
Planets in the sky
What if the other planets in the solar system were orbiting the Earth in place of the Moon? This is what it would look like:
What Victory Looks Like!
The resignation of Hosni Mubarak and the deafening sound of celebration in Egypt (via the Guardian).
Egypt. A victory for peaceful protest (even though they had to fight off attacks).
Going forward, things will not be easy, but for today, euphoria. Will Wilkinson has an excellent essay, in which he puts aside his natural skepticism for a little while:
It is impossible, for me at least, to watch the crowds in Egypt, overjoyed at Hosni Mubarak’s hotly-desired resignation, with dry eyes and an unclenched throat. … Whatever the future holds, there will be disappointment, at best. But there is always disappointment. Today, there is joy.
–Will Wilkinson (2011) Egypt’s Euphoria
Fireworks are necessary:
The singing (via NY Times) before Mubarak’s resignation:
And after:
To be liberated is one thing, but to earn your freedom is fundamentally at another order of magnitude.