Global Atmospheric Circulation and Biomes

We’re studying biomes and I don’t know a better way to consider how they’re distributed around the world than by talking about the global atmospheric circulation system. After all, the primary determinants of a biome are the precipitation and temperature of an area.
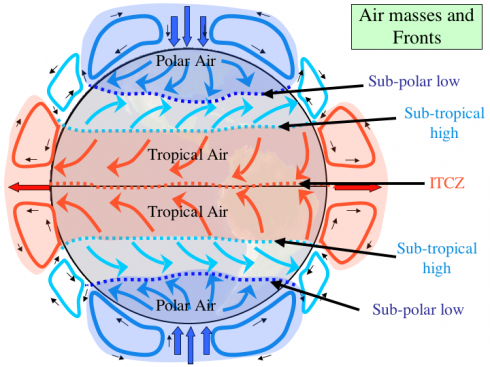
Diagram showing global atmospheric circulation patterns.

It’s a fairly complicated diagram, but it’s fairly easy to reproduce if you remember a few fairly simple rules: hot air rises; the equator is hotter than the poles; and the Earth rotates out from under the atmosphere.

Hot air rises
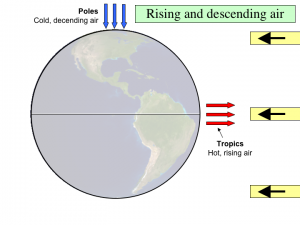
Light from the Sun hits the equator directly but hits the poles at a glancing angle, so the equator is warmer than the poles. Warm air at the equator rises while cold air at the poles sinks.

The equator receives more direct radiation from the Sun. A ray of light from the Sun hits the ground at an angle near the poles so it’s spread out more. More radiation at the equator means the ground (or ocean) is warmer, so it warms up the air, which rises.

The warm air can’t rise forever, gravity puts a stop to that. If we did not have gravity the atmosphere would float off into space (and the universe would be a fundamentally different place). Instead, when the air reaches the upper atmosphere at the equator it diverges, heading either north or south toward the poles.

From all around the hemisphere the air converges on the poles. The air is cooling as it moves away from the equator, and when it gets to the pole it sinks to ground level and then makes the journey back to the equator. It’s a cycle, aka a circulation cell.
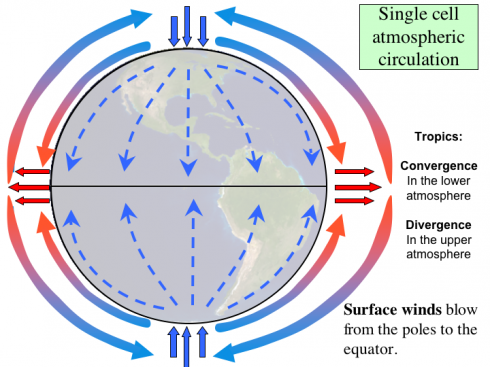
Hot air rising near the equator and sinking near the poles creates a cycle, a circulation cell, in each hemisphere. In this picture, the winds at ground level (dashed blue lines) would always be blowing from the poles toward the equator. This is what the world might be like without the coriolis effect.

Standing on the ground, the wind would always be blowing towards the equator from the poles. If you were in the northern hemisphere, in say Memphis, you would always be getting northerly winds.

The ITCZ and the Polar High

At the equator the rising air also takes with it water vapor that was evaporated from the oceans or from the land (evaporation and transpiration, which are together called evapotranspiration). The warm air cools as it moves up in the atmosphere and the water vapor forms clouds.

You get a lot of clouds and rainfall anywhere there is a lot of rising air.

Because air is coming together, converging, from north and south at the equator, and the equator is in the middle of the tropics, the zone where you get all this rising air is called the Inter-Tropical Convergence Zone or ITCZ for short (that’s an acronym by the way). The ITCZ is pretty easy to identify from space.
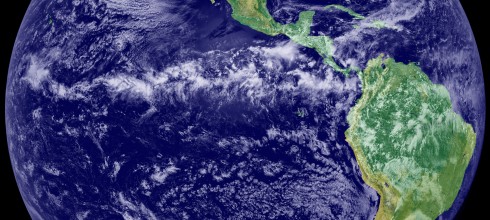
The line of clouds near the equator shows where air is converging at ground level and rising to create clouds. It's called the ITCZ. (Image via NOAA, which also hosts real-time images of the Tropical Atlantic that show the ITCZ very well).

All the rain from the ITCZ, and the warmth of the equator means that when you go looking for tropical rain forests, like the Amazon and the Congo, you’ll find them near the equator.
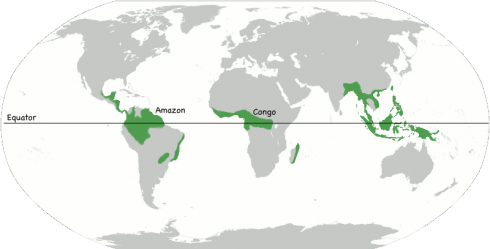
Locations of rainforests (more or less). Notice that in addition to the Congo and Amazon, Indonesia is pretty well forested too. All because of the ITCZ.

Now at the pole, the air is sinking downward from the upper atmosphere. Sinking air tends to be very dry, and places with sinking air also tend to be dry (it’s not a coincidence). So although the poles are covered with ice, they actually tend to get very little snowfall. What little snow they get tends to accumulate over tens, hundreds and thousands of years but the poles are deserts, arctic deserts, but deserts all the same.

The region of sinking air near the poles is called the polar high because of the high pressure generated by all that descending air.

We’ll complicate the picture of atmospheric circulation now, but the ITCZ and the polar high don’t change.

The Earth Rotates

The complication is the coriolis effect. You see, as the Earth rotates it kind-of drags the atmosphere with it. After all, the atmosphere isn’t nailed down. It’s got it’s own motion and intertia, and doesn’t necessarily want to rotate with the Earth.
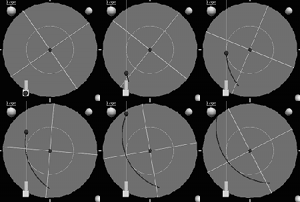
Deflection of the wind, represented by a ball, because of the movement of the Earth beneath it. The ball here moves in a straight line but it appears to curve because the Earth is rotating out from under it. Click the image for a bigger, better version.

So a wind blowing from the North pole to the equator gets deflected to it’s right; the northerly wind becomes an easterly.

I could write an entire post about coriolis (and I will) but for now it shall suffice to say that the low-level wind from the pole gets deflected so much that it never reaches the equator. The high-level wind from the equator never reaches the pole, either. Instead of the one, single, circulation cell in each hemisphere, three develop, and you end up with the picture at the top of this post.

In this diagram, the convention is that it shows the circulation cells along the side of the globe, in profile, while the arrows within the circle of the globe show the wind directions on surface.

Note also that the winds in the region just north of the equator (where the label says “Tropical Air”, come from the northeast. These are the northeast trade winds that were vital to the transatlantic trade in the days of sailing ships. Know about them help a lot in the Triangular Trade game.

The Sub-Tropical High and the Sub-Polar Low

With three circulation cells you add the sub-tropical high, and the sub-polar low to the ITCZ and polar high as major features that affect the biomes.

Remember, rising air equals lots of rain, while descending air is dry.

So the sub-tropical high, with its descending air, makes for deserts. Since it’s in the sub-tropics these are hot deserts, the type you typically think about with sand-dunes, camels and dingos.
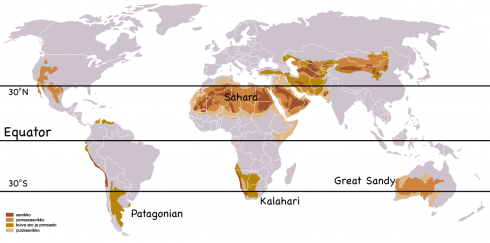
Sub-tropical deserts from around the world. They're located in the zones 30 degrees north and south of the equator at the sub-tropical high. Base map by Vzb83 via Wikimedia Commons.

The USGS also has a great map that names the major deserts.

Biomes

So if we now look at the map of biomes and climates from around the world we can see the pattern: tropical rainforests near the equator, deserts at 30 degrees north and south, temperate rainforests between 40 and 50 degrees latitude, and arctic deserts at the poles.
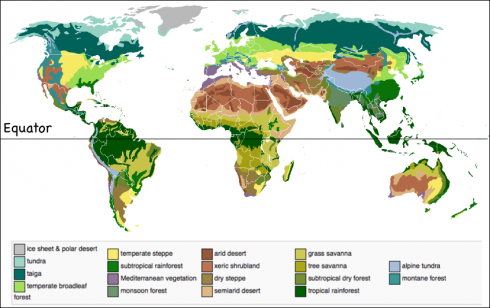
Map of biomes from around the world. The different biomes are closely related to the general atmospheric circulation model. (Image adapted from Sten Porse via Wikipedia)

Coon Creek Immersion: Visiting the Cretaceous

70 million year old shell and its imprint collected at the Coon Creek Science Center.

Just got back from our immersion trip to collect Cretaceous fossils at the Coon Creek Science Center, and hiking in Natchez Trace State Park.

It was an excellent trip. Despite the cold, Pat Broadbent did her usual, excellent job explaining the geology of Coon Creek and showing us how to collect and preserve some wonderful specimens. Back at the cabins, we looked at some of the microfossils from the Coon Creek sediments (and some other microscopic crystals); similar fossils can tell us a lot about the Earth’s past climate.

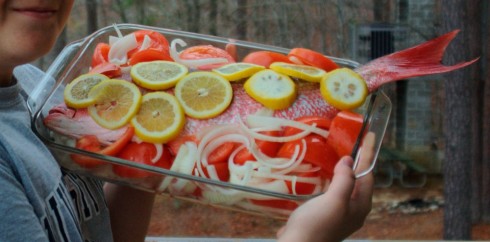
Back at the Park, we traced a streamline from the watershed divide to its marshy estuary, and cooked an excellent seafood dinner as we learned about the major organ systems.

Dinner was delicious.

Our trip was not without difficulties, however. The group learned a bit more about self-regulation, governance and the balance of powers, as a consequence of “The Great Brownie Incident,” and the, “P.E. Fiasco.”

We were also fairly well cut off from the “cloud”: no internet, and you could only get cell reception if you were standing in the middle of the road in just the right spot in front of Cabin #3.

But more on these later. I have some sleep to catch up on.


View Coon Creek Immersion in a larger map

Life in Four Domains

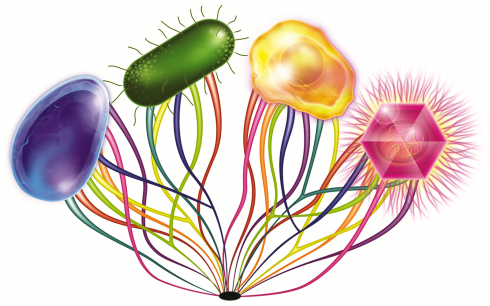
The four domains of life, according to Boyer et al. (2010).

This wonderful, impressionistic image shows representatives of the three domains of life and large viruses, the proposed fourth.

This figure represents the living species in the four small pictures according to the current classification of organisms: eukaryotes (represented by yellow cell), bacteria (represented by green cell), Archaea (represented by blue cell) and viruses (represented by magenta colored Mimivirus).

Boyer et al. (2010): Boyer M, Madoui M-A, Gimenez G, La Scola B, Raoult D (2010) Phylogenetic and Phyletic Studies of Informational Genes in Genomes Highlight Existence of a 4th Domain of Life Including Giant Viruses. PLoS ONE 5(12): e15530. doi:10.1371/journal.pone.0015530

Carl Zimmer has an excellent piece in Discover Magazine that summarizes the research, and sets out the new tree of life. Particularly important, is the fact that viruses can transfer genes with each other. The other domains tend to mix their genes during reproduction.

Using Chromatography as an Analogue for DNA Fingerprinting

Color 'fingerprints', with four color standards labeled Y (yellow), R (red), G (green), and B (blue).
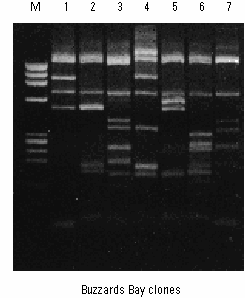
Gene sequences extracted from sediment in Buzzards Bay, MA, and separated using gel electrophoresis (Image from Ford et al., 1998)

One of the more basic techniques in the microbiologist’s toolkit is gel electrophoresis. It’s used to separate long molecules, like proteins, RNA and DNA from one another. Different organisms have different DNA sequences, so electrophoresis can be used to identify organisms and for DNA fingerprinting. Chromatography is also used to separate different molecules, usually pigments. Therefore, using some filter paper, food coloring, and popsicle sticks I created a nice little chromatographic fingerprinting lab exercise using chromatography as an analogue for electrophoresis.

Food colors and test tubes.

Using a standard set of four food colors (red, blue, green and yellow), I grabbed each students individually and had them add three drops of the colors of their choice to a test tube with 1 ml of water in it. One students went with three straight blue drops, but most picked some mixture of colors. I kept track of the color combinations they used, and labeled their test tube with a unique, random number.

When they’d all created their own “color fingerprint” in the test tubes, I handed them back out randomly, and gave them the key of names and color combinations (but no numbers). They had to find out whose test tube they had.

Diffusion of a drop of dye mixture through filter paper. At least three different colors are visible. The colors at the outer edge are the most difficult to distinguish.

I was kind enough to give them a few little demonstrations of chromatography I’d been experimenting with over the last day or so. The easiest technique is simply to place a couple drops of the sample on a filter paper (we used coffee filters “requisitioned” from the teachers lounge), and chase it with a couple drops of water to help the dye spread out. This method works, but since the sample spreads out in a circle, the inverse square law means that the separation of colors can be hard to see.

While the drop method worked well for most students, one who was a bit more analytically-minded, interested in the project, and had a particularly difficult sample, tried doing it using a filter paper column. Since I wanted to show them the proper way of conducting experiments, particularly about the importance of using standards, and I wanted to check if they were able to interpret their results correctly, I also did the full set of samples myself as columns. The standards are essential, because the green food color is actually a mixture of green and blue dyes.

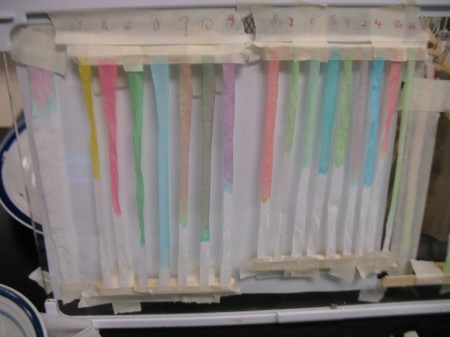
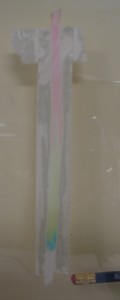
Our color chromatography setup is as you see at the top of this post. We used popsicle sticks to keep the filter paper strips away from the glass surface.

Experiment with filter paper taped to the glass.

The experiments worked well, and for best results, let the it dry because the colors show up better. One focus with my students was on note-taking and recording results; after a few iterations that worked out well too. Another nice aspect of using the series of columns is that it looks a lot like the electrophoresis bands.

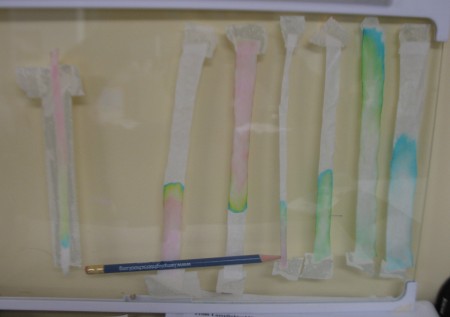
I did try some other variants of the chromatography: top down, bottom up and even taped down. The last version, where I taped the filter paper to the glass to create a restricted column, worked very well.

Variants of the experimental setup are shown in the three columns from left: taped down where the filter paper is taped to the glass; bottom up, where movement of the water and die is driven by capillary action; and top down, where the sample droplet is placed at the top of the column.

Modern Evolution

NYU scientists have traced the evolution of tomcod fish that’s been driven by pollution in the Hudson River. The NPR article is nice because it really breaks down how fish with the right genes preferentially survived the PCBs and dioxins in the river, and passed their genes on.

It also turns out that the fish “selected” for pollution tolerance end up being more sensitive to other things, like high water temperatures. It really puts, “survival of the fittest” in context. The fish are “fit” for polluted rivers, but not “fit” for warmer water.

Amoebas “farming” bacteria

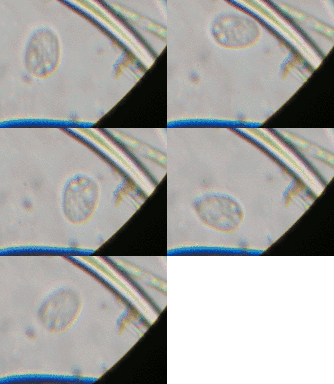
An amoeba going through cytokinesis (Robinson, 2002).
If you look carefully you can see the amoebas zipping around. I also have a really cool larger version too, which shows the entire slide..

Well, since certain organelles within our cells (mitochondria) have their own DNA, it’s been suggested that they were once separate organisms that became the ultimate symbionts. Now, someone’s found that single celled amoebas may actually farm the bacteria they eat.

P.S. While looking for a picture of the guilty party, I came across this nice image of the amoeba, Dictyostelium discoideum, splitting into two on Wikimedia Commons.

Genetic testing: What it can do, and where we are.

“On average we found that each of us carries two or three mutations that could cause one of these severe childhood diseases.”
–Stephen Kingsmore, physician, Children’s Mercy Hospital in Greenfieldboyce (2010), New Genetic Test Screens Would-Be Parents.

NPR’s All Things Considered had two related articles on last night that deal with the specific topics we’re covering this week: genetic disease and recessive alleles.

The first one is about the latest in genetic screening technology, for determining if potential parents have recessive alleles that could combine to produce children with genetic diseases. Recent research has made this much easier.

The second touches on the ethical consequences of genetic screening. It could lead to an increase in abortion rates and leads us along the slippery slope of eugenics.

Beggars in Spain, by Nancy Kress
What if we engineered for intelligence?

This second story would make an interesting basis for a Socratic dialogue. As would, I think, the movie Gattica, which deals with the consequences of genetic screening and genetic customizations. I see it’s PG-13 so we may be able to screen it. Similarly, I may recommend Brian Stableford’s War Games to my eight graders who might like a military science fiction book that deals with genetic optimization. Alternatively, Nancy Kress’ Beggars in Spain might offer another interesting perspective on this issue.