Ed Hawkins posted this extremely useful visualization of month-by-month, global temperature changes since 1850.
Tag: climate change
Melting Ice Caps and Flooding in Miami
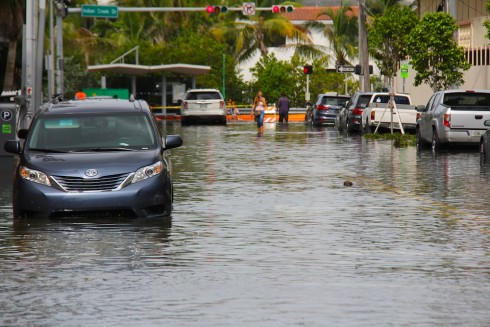
The Siege of Miami: A detailed report that looks at the increasing frequency of flooding in Miami, because of sea-level-rise. The reporter interviews a number of scientists and engineers who are not terribly optimistic about the long-term (50+ years) future of many Floridian cities because of the melting ice-caps in Greenland and Antarctica.
Global Warming and the War in Syria

A 2011 article from the National Oceanic and Atmospheric Administration linked recent severe droughts in the Mediterranean to anthropogenic climate change. Now Francesco Femia and Caitlin Werrell assert that the drought (and agricultural mismanagement) lead to the displacement of a million and a half people in Syria, which helped spark the current civil war.
Additional links:
- Understanding Syria: From Pre-Civil War to Post-Assad by William R. Polk: A good summary of the history and geography of Syria.
- WikiLeaks, Drought and Syria by Thomas Friedman: Cables from 2008, outline Syria’s growing recognition of the potential for civil unrest because of the drought.
- Drought Helped Spark Syria’s Civil War — Is it One of Many Climate Wars to Come? by John Light: Another interview with Fermia about the potential for future wars.
Conflict over water
One of the articles my students brought to our Environmental Science discussion was about the growing fears about wars over water. Even within the U.S.A. there are significant conflicts, as demonstrated by this NPR article.
Texas has tried to buy Oklahoma water from the state, its cities and towns, and its Native American tribes. But Oklahoma lawmakers have blocked those efforts with a string of laws restricting out-of-state water exports.
The view in Texas is that Oklahoma isn’t even using its full allocation of Red River water. Oklahomans respond that Texas hasn’t gotten serious enough about conservation.
“Our poor, poor thirsty people in Dallas, Texas,” muses state Sen. Jerry Ellis, a Democrat who represents southeastern Oklahoma. “There’s nobody thirsty in Dallas, Texas.”
— Wertz,J., 2013: Thirsty States Take Water Battle To Supreme Court on NPR.
The full article:
P.S. Lauren Markham has an article about environmental “refugees” forced to leave Ethiopia because of the changing rainfall patterns over the last eight years.
Act Now: The Exponentially Increasing Costs of Not Acting on Climate Change
Andrew Sullivan pulls together commentary on a recent research paper that shows that the costs of waiting to act on climate change, far outweigh the costs of acting now. The longer we wait, the more it’s going to cost to prevent the most dangerous effects of climate change. Unfortunately, the costs of waiting will be paid in the future (as will the benefits), so there’s less motivation to act now.
Two degrees is the level that is currently supported by over 190 countries as a limit to avoid dangerous climate change …
“Ultimately, the geophysical laws of the Earth system and its uncertainties dictate what global temperature rise to expect,” said Rogelj. “If we delay for twenty years, the likelihood of limiting temperature rise to two degrees becomes so small that the geophysical uncertainties don’t play a role anymore.”
–Climate Progress (2013): Nature: Limiting Climate Change Will Become Much Harder ‘And More Expensive If Action Is Not Taken Soon’ on ThinkProgress.
On top of this, Fiona Harvey reports on an International Energy Agency report that suggests:
The world is likely to build so many fossil-fuelled power stations, energy-guzzling factories and inefficient buildings in the next five years that it will become impossible to hold global warming to safe levels, and the last chance of combating dangerous climate change will be “lost for ever”, according to the most thorough analysis yet of world energy infrastructure.
— Harvey (2011): World headed for irreversible climate change in five years, IEA warns in The Guardian.
Climate by Proxy
Both [thermometer and proxy] records also show that the global warming in the last 15 years of the record (1980–1995) is significantly faster than that of the long-term trend (1880–1995).
— NOAA (2013): Independent Evidence Confirms Global Warming in Instrument Record.
To figure out what the weather and climate were like in the past, before things like thermometers were invented, scientists use proxies such as: the change in tree ring thickness; differences in the isotopic composition of shells and rocks; records of species change in the oceans; gases in bubbles trapped in glacial ice (as well as the character of the ice itself). Paleoclimatologists at NOAA have analyzed 173 different proxy records to provide a lot more evidence that the increase in temperature we’ve been measuring for the last 150 years (with thermometers) is real.
<a href=”http://www.curatorscode.org” target=”_blank” style=”font-family:sans-serif;text-decoration:none” >↬</a> The Dish
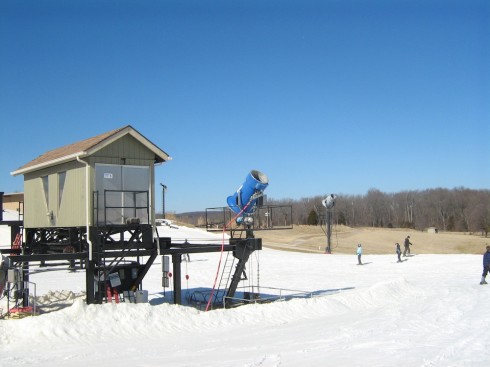
Ski Trip (to Hidden Valley)
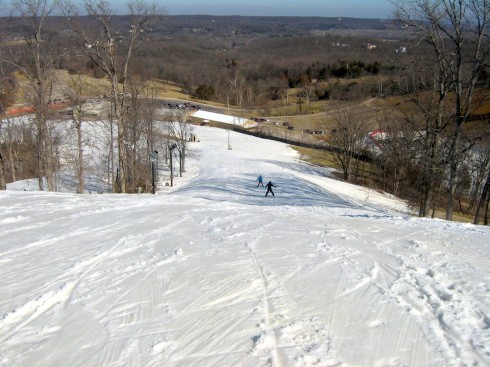
We took a school trip to the ski slopes in Hidden Valley. It was the interim, and it was a day dedicated to taking a break. However, it would have been a great place to talk about gradients, changes in slopes, and first and second differentials. The physics of mass, acceleration, and friction would have been interesting topics as well.
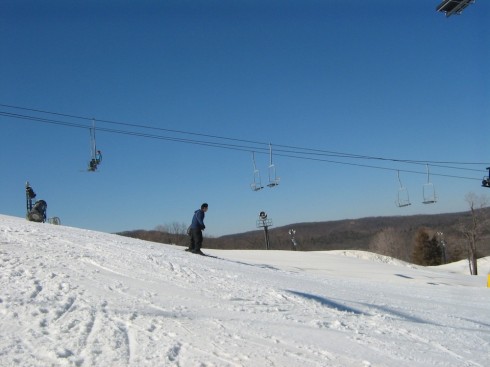
This year has been cooler than last year, but they’ve still struggled a bit to keep snow on the slopes. They make the snow on colder nights, and hope it lasts during the warmer spells. The thermodynamics of ice formation would fit in nicely into physics and discussion of weather, while the impact of a warming climate on the economy is a topic we’ve broached in environmental science already.
Wiggle Matching: Sorting out the Global Warming Curve
To figure out if the climate is actually warming we need to extract from the global temperature curve all the wiggles caused by other things, like volcanic eruptions and El Nino/La Nina events. The resulting trend is quite striking.
I’m teaching pre-Calculus using a graphical approach, and my students’ latest project is to model the trends in the rising carbon dioxide record in a similar way. They’re matching curves (exponential, parabolic, sinusoidal) to the data and subtracting them till they get down to the background noise.

