This little embeddable, interactive app uses nth order polynomials to approximate a few curves to demonstrate the Taylor Series.
Tag: embeddable graphs
Programming Numerical Integration with Python (and Javascript)

I gave a quick introduction to programming for my calculus class, which has been working on numerical integration.
Numerical integration is usually used for functions that can’t be integrated (or not easily integrated) but for this example we’ll use a simple parabolic function so we can compare the numerical results to the analytical solution (as seen here).
With the equation:
![]()
To find the area under the curve between x = 1 and x = 5 we’d find the definite integral:
![]()
which gives the result:
![]()
For numerical integration, we break the area of concern into a number of trapezoids, find the areas of all the trapezoids and add them up.
We’ll define the left and right boundaries of the area as a and b, and we can write the integral as:
![]()

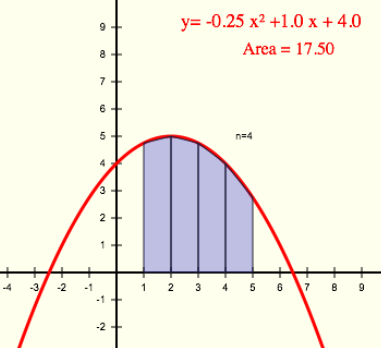
We also have to choose a number of trapezoids (n) or the width of each trapezoid (dx). Here we choose four trapezoids (n = 4), which gives a trapezoid width of one (dx = 1).

So if we define the x values of the left and right sides of the first trapezoids as x0 and x1, the area of the first trapezoid is:
![]()
For this program, we’ll set the trapezoid width (dx) and then calculate the number of trapezoids (n) based on the width and the locations of the end boundaries a and b. So:
![]()
and the sum of all the areas will be:
![]()
We can also figure out that since the x values change by the same value (dx) for every trapezoid, it’s an arithmetic progression, so:
![]()
and,
![]()
so our summation becomes:
![]()
Which we can program with:
numerical_integration.py
# the function to be integrated
def func(x):
    return -0.25*x**2 + x + 4

# define variables
a = 1.          # left boundary of area
b = 5.          # right boundary of area
dx = 1          # width of the trapezoids

# calculate the number of trapezoids
n = int((b - a) / dx)

# define the variable for area
Area = 0

# loop to calculate the area of each trapezoid and sum.
for i in range(1, n+1):
    #the x locations of the left and right side of each trapezpoid
    x0 = a+(i-1)*dx
    x1 = a+i*dx

    #the area of each trapezoid
    Ai = dx * (func(x0) + func(x1))/ 2.

    # cumulatively sum the areas
    Area = Area + Ai

#print out the result.
print "Area = ", Area
And the output looks like
>>>
Area =  17.5
>>>
While the programming is pretty straightforward, it was a bit of a pain getting Python to work for one of my students who is running Windows 8. I still have not figured out a way to get it to work properly, so I’m considering trying to do it using Javascript.
Update
The javascript functions for numerical integration:
function numerically_integrate(a, b, dx, f) {

	// calculate the number of trapezoids
	n = (b - a) / dx;

	// define the variable for area
	Area = 0;

	//loop to calculate the area of each trapezoid and sum.
	for (i = 1; i <= n; i++) {
		//the x locations of the left and right side of each trapezpoid
		x0 = a + (i-1)*dx;
		x1 = a + i*dx;

		// the area of each trapezoid
		Ai = dx * (f(x0) + f(x1))/ 2.;

		// cumulatively sum the areas
		Area = Area + Ai

	}
	return Area;
}

//define function to be integrated
function f(x){
	return -0.25*Math.pow(x,2) + x + 4;
}

// define variables
a = 1;		// left boundary of area
b = 5;		// right boundary of area
dx = 1;		// width of the trapezoids

// print out output
alert("Area = "+ numerically_integrate(a, b, dx, f));
This is a demonstration of a full html file that uses the function, and should work in any modern browser (download files: numerical-integration.zip).
Update 2
I’ve added the above javascript code to the embeddable graphs to allow it to calculate and display numerical integrals: you can change the values in the interactive graph below.
Numerical Integration
This is an attempt to illustrate numerical integration by animating an HTML5’s canvas.
We’re trying to find the area between x = 1 and x = 5, beneath the parabola:
![]()
By integrating, the area under the curve can be calculated as being 17 ⅔ (see below for the analytical solution). For numerical integration, however, the area under the curve is filled with trapezoids and the total area is calculated from the sum of all the areas. As you increase the number of trapezoids, the approximation becomes more accurate. The reduction in the error can be seen on the graph: with 1 trapezoid there is a large gap between the shaded area and the curve; more trapezoids fill in the gap better and better.
The table below show how the error (defined as the difference between the calculation using trapezoids and the analytic solution) gets smaller with increasing numbers of trapezoids (n).
| Number of trapezoids | Area (units2) | Error (difference from 17.66) |
|---|---|---|
| 1 | 15.00 | 2.66 |
| 2 | 17.00 | 0.66 |
| 3 | 17.37 | 0.29 |
| 4 | 17.50 | 0.16 |
| 5 | 17.56 | 0.10 |
| 6 | 17.59 | 0.07 |
| 7 | 17.61 | 0.05 |
| 8 | 17.63 | 0.03 |
| 9 | 17.63 | 0.03 |
| 10 | 17.64 | 0.02 |
Analytic solution
The area under the curve, between x = 1 and x = 5 can be figured out analytically by integrating between these limits.
![]()
![]()
![]()
![]()
![]()
![]()
(See also WolframAlpha’s solution).
Update
Demonstration of this numerical integration using four trapezoids in embeddable graphs.