Nuclear Meltdown in Japan

CNN has an informative interview on the explosion at the Fukushima nuclear plant in Japan after the earthquake and tsunami.

Footage of the explosion from the BBC:

Nuclear disasters are so rare that they’re easy to forget about when we’re talking about the right mix of alternative (non-carbon based) energy sources for the future.

Right after the accidents at Three Mile Island in 1979 and Chernobyl in 1986, awareness of the dangers lead to a de facto moratorium on nuclear power plants in the U.S.. This was good in that people were now treating nuclear power much more respectfully, and incorporating the costs of potential accidents into their calculations. However, it also reduced the interest and effort of developing newer and safer types of nuclear plants.

We’ll have this discussion next year when we focus more on the physical sciences.

UPDATE:

1. More details on how nuclear plants work can be found in Maggie Koerth-Baker’s post, Nuclear energy 101: Inside the “black box” of power plants.
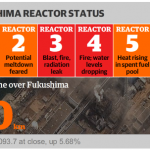
Fukushima reactor status as of March 16th, 5:00 pm GMT from the Guardian live blog.

2. The Guardian’s live blog has good, up-to-date information on the status of the nuclear reactors at Fukushima.

Finite resources

When will we run out of natural resources, either from depletion of non-renewables or overuse of renewables? Scientific American has a great interactive graph charting How Much Is Left that would tie in really well to our cycle on natural resources.

How Much Is Left? interactive graph. from Scientific American

The caveat is that it is notoriously difficult to really figure out how much of a resource is left. For one thing, there might be undiscovered deposits, or we could find ways of using it more efficiently to extend its lifetime. As resources get more scarce their price goes up which gets people more interested in discovering more or coming up with better, more efficient, methods of extracting things like minerals from alternative sources. If we start to run out of Lithium for batteries maybe someone will develop a process to extract it from seawater. Or, as oil gets harder to extract and its price goes up, perhaps there will be more investment in alternative energy technologies like wind farms, tidal generators and solar convection towers.

Oil slick

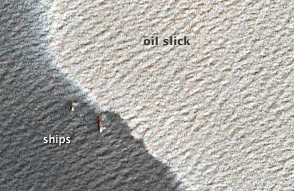
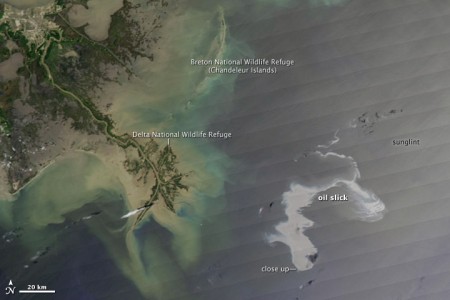
Oil slick in the Gulf of Mexico on April 25th, 2010. Image from NASA.

The scale of the disaster caused by the oil leaking into the Gulf of Mexico from the damaged oil rig is increasing day by day. We are preparing to go on the end-of-year adventure trip soon, but I’m wondering if students might be interested in heading down to the Gulf coast to volunteer in the clean-up.

Scale of the slick. Image from NASA (April 25th).

NASA’s Earth Observatory has some amazing imagery on its page on the oil leak. Many of the images also show the mouth of the Mississippi and its delta, which tie directly into our observations in the sandbox. The impact of the oil spill also brings up the topic of density differences in fluids, something we’ve seen in the making bread jars, but applied to a much larger scale.

Hydrogen fuel

Hydrogen is an alternative source of fuel (alternative to fossil fuels), but it can be produced from renewable or non-renewable sources. PBS and Scientific American Frontiers have a nice video on hydrogen fuel. They first visit a lab producing hydrogen fuel cells. The second part of the program visits Iceland is trying to use geothermal energy to create the hydrogen. They also discuss producing hydrogen from solar-electric and algae.

Oil traps and deltas in the sandbox

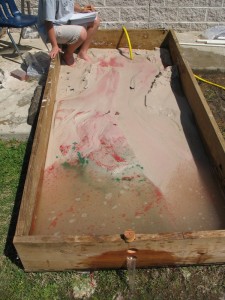
Red and green sand added for marker beds.

The sandbox was built to be a wave tank so we could look at interference patterns and wave properties. But if you tilt it a little, and put in a few holes on the lower end, you can get sandbox to look at the formation of streams, deltas and the sedimentary layering that traps oil and natural gas.

Using the holes at the bottom end the students started with a low “sea-level”, raised it and lowered it. At the end of the run, they drained all the water and sliced the tank to see the depositional layers in cross-section.

We added red and green sand to try to make marker beds before each change in base level. The marker beds worked reasonably well, but it would have been better to have sand with different densities that could be sorted by the stream flow and depositional environment. It also helps to get the colored sand wet, to make a slurry, otherwise the grains will float on the water.

The shifting lobes of the delta showed up very well (see the animation) and some nice river features showed up as well. What I want to do sometime is to have students build coastlines and have waves erode them away creating typical coastal features.

My students were even able to demonstrate the tank for their presentation, because it really only takes half an hour to get all the features if you know what you’re aiming for.

Sources

The exercise these results are based on is posted as The Geology of Oil Traps Activity.

Passive solar collector project

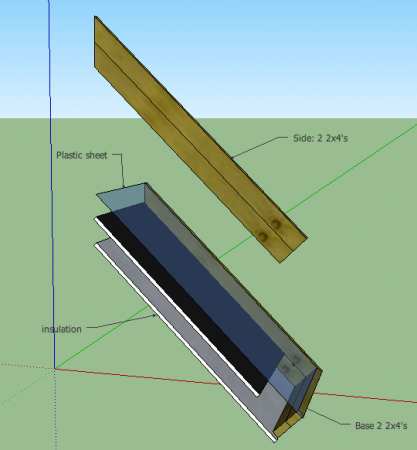
SketchUp model of our simple solar heat collector.

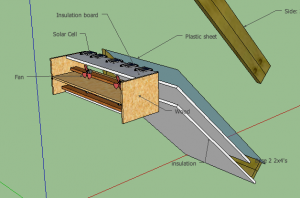
For real experiential learning, projects should have useful, practical applications. This passive, solar heat collector window unit seems pretty easy to build (you’ll find out more about it in about a week). It’s passive because there are no fans to push the air through the collector, the air flows through it because of the hot air in the upper channel rises, creating a siphoning effect that drags cool air into the lower chamber. With a couple solar cells and spare electric motors from some toy cars, however, we should be able to turn it into an active, forced-convection heater. What’s nice, is that we can now demonstrate two methods of capturing solar energy.

Solar powered fans for forcing convection in the solar collector

This project may also work well if it’s split into two, the solar collector and the photoelectric fan system, and at the end the students bring them both together to create a single unit.

Directions to build similar units can be found on the Build it Solar website and the Solar Heater page. Mother Earth News has an article from 1977 on how to construct one. These images were produced from a Google SketchUp model, which is really useful in trying to prototype little constructions like this. Though, I probably spend too much time trying to get the models to look just right.

The Build it Solar website is a great resource for practical solar projects.

Methane hydrates for energy

Despite the fact that methane is a powerful greenhouse gas itself and burning it produces carbon dioxide there is currently quite a bit of research on extracting methane hydrates from the sea floor as an alternative to the traditional fossil fuels because there is just so much of it. Discovery Channel has an interesting video on the topic where they burn some methane hydrate ice.

Methane releases from the arctic and sea-floor could also trigger rapid climate change. Recent discoveries suggest that global warming is warming the arctic so much that the permafrost is melting an releasing a lot of methane into the atmosphere. If the arctic atmosphere continues to warm, more methane will be released, causing more warming …. This positive feedback loop would accelerate global warming. Some scientists worry that warmer ocean waters can melt methane hydrates at the sea floor releasing them into the atmosphere in a similar positive feedback loop.