Experiments for Demonstrating Different Types of Mathematical Functions

This is my quick, and expanding, reference for easy-to-do experiments for students studying different types of functions.

Linear equations: y = mx + b

  • Bringing water to a boil (e.g. Melting snow)
  • Straight line, motorized, motion. (e.g. Movement of a robot/Predicting where robots will meet in the middle)
  • Current versus Voltage across a resistor as resistance changes.

Quadratic equations: y = ax2 + bx + c

Exponential functions: y = aekx

  • Cooling water (ref.)

Square Root Functions: y = ax1/2

Trigonometric Functions: y = asin(bx)+c

A Concept Map for Mathematical Functions

Analyzing functions.

This year I’m trying teaching pre-Calculus (and it should work for some parts of algebra as well) based on this concept map to use as a general way of looking at functions. Each different type of function can by analyzed by adapting the map. So linear functions should look like this:

Adapting the general concept map for linear functions.

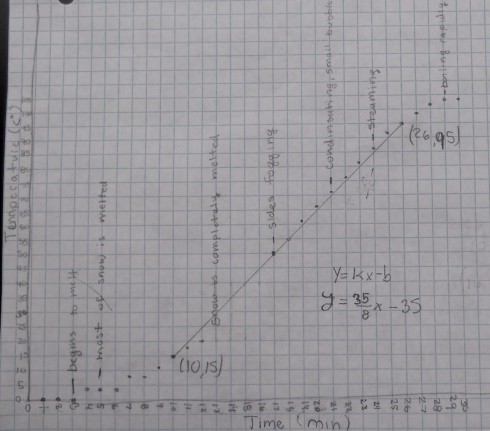
You’ll note the bringing water to a boil lab at the bottom left. It’s an adaptation of the melting snow lab my middle schoolers did. For the study of linear equations we’ll define the function using piecewise defined functions.

The rising temperatures in the middle of the graph can be modeled with a straight line. Graph by A.F.
The relationship between temperature and time on a hotplate. The different parts of the graph can be defined by a piecewise function. Graph by A.F.

Working with Climate Data

Monthly climatic data from the Eads Bridge, from 1893 to the 1960’s. It’s a comma separated file (.csv) that can be imported into pretty much any spreadsheet program.

135045.csv

The last three columns are mean (MMNT), minimum (MNMT), and maximum (MXMT) monthly temperature data, which are good candidates for analysis by pre-calculus students who are studying sinusoidal functions. For an extra challenge, students can also try analyzing the total monthly precipitation patterns (TPCP). The precipitation pattern is not nearly as nice a sinusoidal function as the temperature.

Students should try to deconstruct the curve into component functions to see the annual cycles and any longer term patterns. This type of work would also be a precursor the the mathematics of Fourier analysis.

This data comes from the National Climatic Data Center (NCDC) website.