Individual Research Project Presentations

My students just presented their Individual Research Projects (IRPs) to their peers and their parents, and, I have to say, they did quite a good job.
Image by Ryan W.

They’re called IRPs, but while they are independent projects, they actually don’t all have to be research. This year we had a number of research papers, a few experiments, a short story, and computer program. The last two were by graduating eight graders, who I like to encourage to do something different that aligns with their interests: one wants to be a writer, while the other is really interested in programming.

Now you’re thinking, “That family is mean!” You could say that, but that’s not why we do it.

– From “Beverly” by P.Z.
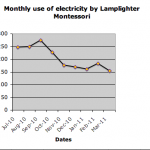
Graph by Ben T.

It helped that it was a friendly audience who’d just been fed (food always helps), but it was nice to see how confident they were, and, as one parent remarked to me, how much progress they make from year to year. Even my shyest student had everyone laughing with her short story.

Even better still, was the fact that although I did not have the time to review all the presentations in great detail (students have to write a report first, which tends to be the focus of my reviews), the peer-review process, and the experience they’ve had doing presentations all year, really paid off.

And on average, an increase of .100 OPS adds 2 million to the player’s salary. So players on steroids on average get $12,512,630 more throughout their career.

-Michael F. in ” ‘roids”

Tomorrow is graduation, which I always find to be anticlimactic; after all, it’s the work that important and interesting, not so much the diploma at the end. These excellent presentations however, were a great way to cap off the year.

Multi-modal IRP’s

If I present information to you orally, you’ll probably only remember about 10% 72 hours after exposure, but if I add a picture, recall soars to 65%.

–Alex Lundry (2009): Chart Wars: The Political Power of Data Visualization

How you present visual information is important. And my students are discovering this as they work up their Independent Research Projects (IRP’s) this week.

In the spring they are fairly free to pick their topic and style of IRP. Some choose research projects, others term papers, and a few do things that strike their fancy, like writing fiction or programming games.

In the end, they submit a written report and give a presentation.

For research projects, I have one student who did a great job of coming up with a hypothesis and testing it. He even compiled a nice table of his data for his results section, but was reluctant to go through the effort of making a graph. After all, he claimed, anyone reading his report (or watching his PowerPoint presentation) could just look at the table and read the data off there themselves.

My response was that people absorb the data much more effectively when it’s presented graphically. Fortunately, Alex Lundry has a nice little presentation that reinforces this point. It also gives a few tips about what to look out for in graphics, because they can be used to mislead.

The key quote (via The Dish) is this:

Vision is our most dominant sense. It takes up 50% of our brain’s resources. And despite the visual nature of text, pictures are actually a superior and more efficient delivery mechanism for information. In neurology, this is called the ‘pictorial superiority effect’ […] If I present information to you orally, you’ll probably only remember about 10% 72 hours after exposure, but if I add a picture, recall soars to 65%. So we are hard-wired to find visualization more compelling than a spreadsheet, a speech of a memo.

–Alex Lundry (2009): Chart Wars: The Political Power of Data Visualization

Here’s Lundry’s five minute presentation.

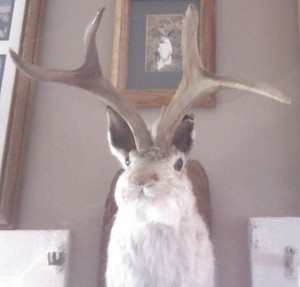
Jackalopes

“It’s like finding out Santa Claus doesn’t exist.”

That was my student’s response on discovering that jacklopes do not actually exist.

She’d been planning on doing her Independent Research Project on jacklopes. She’d already invested some time in doing some internet research, and this morning she came up to me and asked, “Are jacklopes real?”

A jackalope on the wall of a restaurant near the west entrance to Death Valley (image by SedesGobhani via Wikimedia Commons).

I told her they weren’t, but she had to go look them up herself in actual hardcopy, the Wildlife Fact-file binders that we keep on the reference shelf. They weren’t in there.

I offered that she could still do her IRP on jackalopes, just focusing on the cultural meanings and reasons behind the phenomenon. Also she could discuss the potentials for genetically engineered organisms.

She’s still considering it.

On Rabbit Digestion

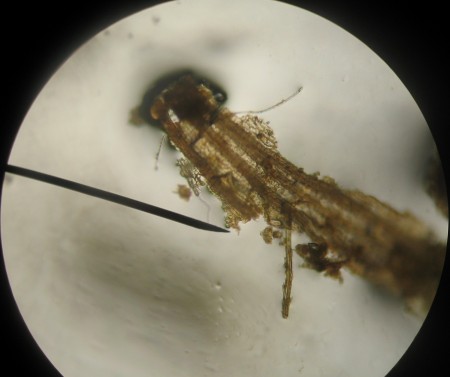
Figure 1. Undigested fiber from rabbit fecal pellets.

One of my favorite things is when my students teach me something I didn’t know. One of those things is that rabbits eat their own poop.

Well not exactly. According to Dana Krempels, from the University of Miami, rabbit fecal pellets (poop) are different from the other type of droppings that lagomorphs actually eat, which are called cecotropes (Kempels, 2010; Rabbits: The Mystery of Poop). Cecotropes apparently have lots of helpful bacteria and nutrients. Rabbits that don’t get to eat them tend to suffer from malnutrition.

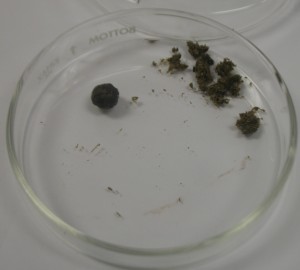
Figure 2. Rabbit fecal pellets, with one mostly dissected, in a standard petri dish.

Independent Research Project

For her Independent Research Project (IRP) this term, one of my students researched rabbits, and, as was required, tried to find them on our nature trail. She found indirect evidence. Small fecal pellets in the grassy area next to the trail’s exit, just where her research said they might be (which was quite nice). The pellets were brought inside, dissected, and examined under the microscope (see Figures 1 and 2).

The magnified image showed what appeared to be a partially masticated (chewed) piece of fiber, probably grass. This is where I was informed about the double eating called cecotrophy. My student hypothesized that this sample might be something that had not been fully digested and the rabbit would come back and eat it another time.

The Scientific Process

I really like the scientific process that went into this project, even though I’m not sure I agree with the final hypothesis. The project started with background research that yielded a plan for field observation. The field observation resulted in samples being collected and returned to the lab for analysis. The analysis produced some interesting, enigmatic results, which lead to a proposed hypothesis that integrated the observations based on the original background research.

The only things I would like to add to this type of IRP is to have students include a detailed scientific sketch, much like the sketches of the early botanists and naturalists. I really like how these drawings integrate acute observation and artistic interpretation.

Luring vultures

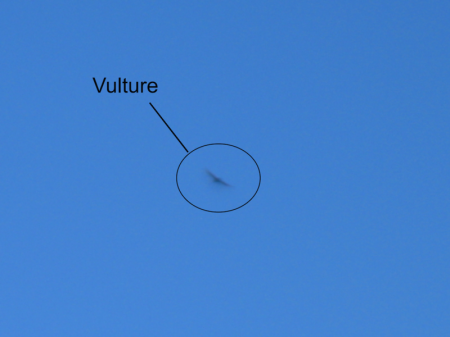
The theme for this term’s Independent Research Project is Life on the Nature Trail, and my students are required to do some actual field work on the species or taxonomic group they’ve chosen to investigate. One students chose vultures because they saw one in the clearing just outside the trail and we’ve occasionally caught sight of one soaring over the campus.

He’s been trying to lure one in for a closer look.

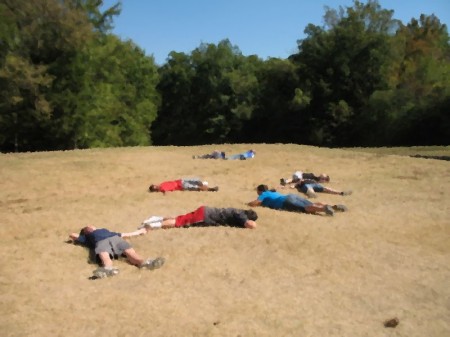
Since I’ve vetoed the idea of leaving fresh meat out, unless he finds professional to guide him, he’s asked for permission to lie out on the grass pretending to be carrion.

I let him take the camera (see above).

Today we saw one swoop past during P.E., so we took a couple minutes trying to lure vultures (see below).

Unfortunately, it did not seem to work.

Mushrooms, in detail

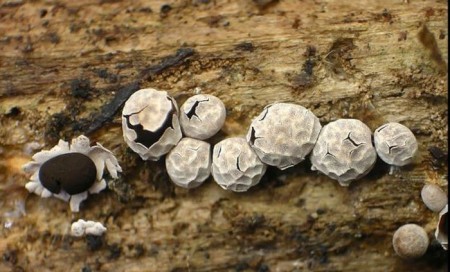
Image from World of Technology: Beautiful Shrooms.

Sometimes beauty is in the details. The World of Technology blog has a wonderful collection of close-up images of mushrooms. One of my students is working on an Independent Research Project on the fungi on our nature trail. Hopefully this might help spark the imagination.