Using Chromatography as an Analogue for DNA Fingerprinting

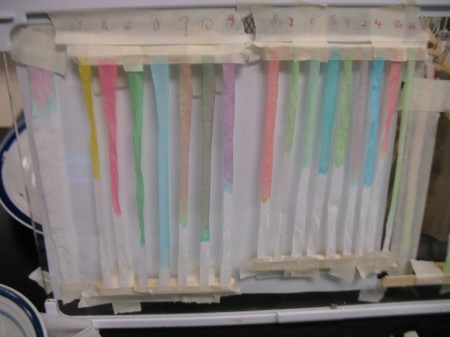
Color 'fingerprints', with four color standards labeled Y (yellow), R (red), G (green), and B (blue).
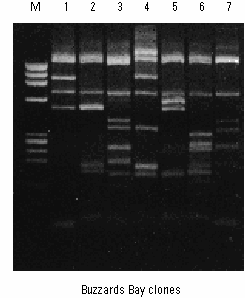
Gene sequences extracted from sediment in Buzzards Bay, MA, and separated using gel electrophoresis (Image from Ford et al., 1998)

One of the more basic techniques in the microbiologist’s toolkit is gel electrophoresis. It’s used to separate long molecules, like proteins, RNA and DNA from one another. Different organisms have different DNA sequences, so electrophoresis can be used to identify organisms and for DNA fingerprinting. Chromatography is also used to separate different molecules, usually pigments. Therefore, using some filter paper, food coloring, and popsicle sticks I created a nice little chromatographic fingerprinting lab exercise using chromatography as an analogue for electrophoresis.

Food colors and test tubes.

Using a standard set of four food colors (red, blue, green and yellow), I grabbed each students individually and had them add three drops of the colors of their choice to a test tube with 1 ml of water in it. One students went with three straight blue drops, but most picked some mixture of colors. I kept track of the color combinations they used, and labeled their test tube with a unique, random number.

When they’d all created their own “color fingerprint” in the test tubes, I handed them back out randomly, and gave them the key of names and color combinations (but no numbers). They had to find out whose test tube they had.
Diffusion of a drop of dye mixture through filter paper. At least three different colors are visible. The colors at the outer edge are the most difficult to distinguish.

I was kind enough to give them a few little demonstrations of chromatography I’d been experimenting with over the last day or so. The easiest technique is simply to place a couple drops of the sample on a filter paper (we used coffee filters “requisitioned” from the teachers lounge), and chase it with a couple drops of water to help the dye spread out. This method works, but since the sample spreads out in a circle, the inverse square law means that the separation of colors can be hard to see.

While the drop method worked well for most students, one who was a bit more analytically-minded, interested in the project, and had a particularly difficult sample, tried doing it using a filter paper column. Since I wanted to show them the proper way of conducting experiments, particularly about the importance of using standards, and I wanted to check if they were able to interpret their results correctly, I also did the full set of samples myself as columns. The standards are essential, because the green food color is actually a mixture of green and blue dyes.

Our color chromatography setup is as you see at the top of this post. We used popsicle sticks to keep the filter paper strips away from the glass surface.
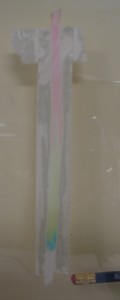
Experiment with filter paper taped to the glass.

The experiments worked well, and for best results, let the it dry because the colors show up better. One focus with my students was on note-taking and recording results; after a few iterations that worked out well too. Another nice aspect of using the series of columns is that it looks a lot like the electrophoresis bands.

I did try some other variants of the chromatography: top down, bottom up and even taped down. The last version, where I taped the filter paper to the glass to create a restricted column, worked very well.
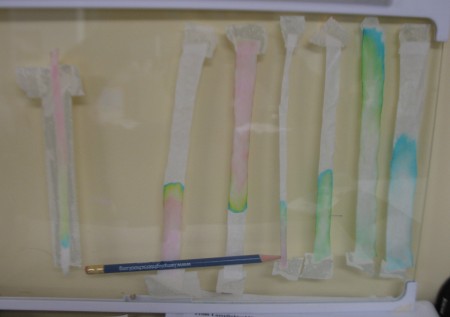
Variants of the experimental setup are shown in the three columns from left: taped down where the filter paper is taped to the glass; bottom up, where movement of the water and die is driven by capillary action; and top down, where the sample droplet is placed at the top of the column.

iPod stands

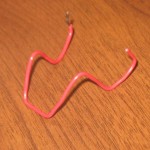
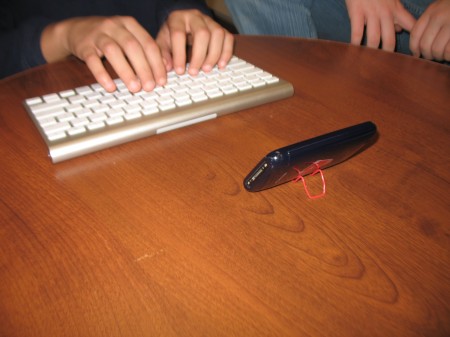
Red paperclip iPhone stand.

I’ve been hoping for a wireless keyboard for the iPhone for quite a while, and Apple has finally produced one. As far as my students are concerned, with a full keyboard to write useful amounts of text, the iPhone is almost as good as having a “normal” computer. And the same applies to the iPad as well.

Once you have the keyboard, however, he next question is, how do you get the iPhone to sit at the correct angle for you to do your work. My students have dug up a couple solutions, starting with the paperclip version you see above. Simple, cheap, and elegant; I really like it.

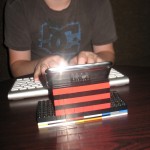
Lego iPhone stand. The bright sparkles are purely a function of unapologetic awesomeness.

A couple days after seeing the paperclip stand in action, I came across the Lego stand.

“Why,” I asked.

“Because it’s awesome.”

“Oh,” I replied.

And it is.

Student blog update

Well, I’ve made sure that everyone who wants one has a blog, and I’m still finding that the girls are the ones who’re updating them while the boys are not.

This is a small class, so we can’t have any statistical confidence in this observation, but for now at least, the trend continues.

I have also noticed that some of my bloggers are using their Personal World time to blog. I did not require this, or even suggest it, but I think this is great because they’re doing exactly the type of self-reflection that Personal World is intended to elicit.

What is “Natural”?

The Trans Alaska pipeline. The bend is due to the fact that it's sitting on a faultline. (Image via the USGS)

Back in 1991, Jay Anderson wrote and interesting article (free pdf) on how exactly to go about measuring “naturalness”.

After all, anywhere you go in this world, you’ll find it has been impacted by humans to some degree: agriculture in Brazil is affecting rainfall patterns in the remotest parts of the Amazon basin; and soot and anthropogenic chemicals gently, and subtly, contaminate the remotest Antarctic Ice Caps.

Anderson came up with three things to look at, but I think the two key are:

  1. how much things would change if you removed people,
  2. how many native species there are compared to how many their were in the past.

I think it’s important to try to at least better define what we mean by the word “natural” as we think about conserving the environment.

The World without Us by Alan Weisman

Anderson’s first point, about how much things would change if you removed the people, also brings to mind Alan Weisman’s book, The World without Us, which imagines what the world would look like if humans disappeared: what would happen to the cities and artifacts we leave behind?

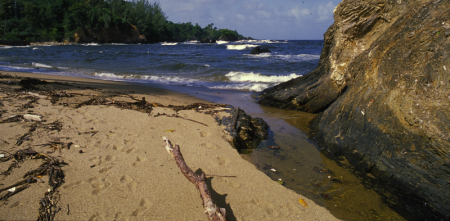
Footprints in the sand of a small bay on the northeastern coast of Trinidad.

Amoebas “farming” bacteria

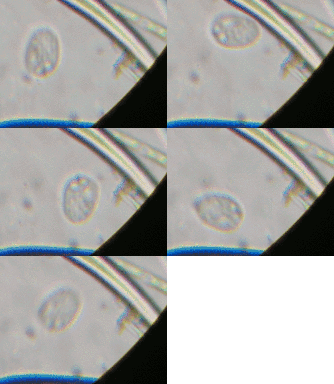
An amoeba going through cytokinesis (Robinson, 2002).
If you look carefully you can see the amoebas zipping around. I also have a really cool larger version too, which shows the entire slide..

Well, since certain organelles within our cells (mitochondria) have their own DNA, it’s been suggested that they were once separate organisms that became the ultimate symbionts. Now, someone’s found that single celled amoebas may actually farm the bacteria they eat.

P.S. While looking for a picture of the guilty party, I came across this nice image of the amoeba, Dictyostelium discoideum, splitting into two on Wikimedia Commons.

POV-Ray: 3d rendering

Giles Tran’s amazing rendering of glasses on the counter inspired me to check through my own POV-Ray generated library. Nothing nearly as good, but some of it is still might be useful.

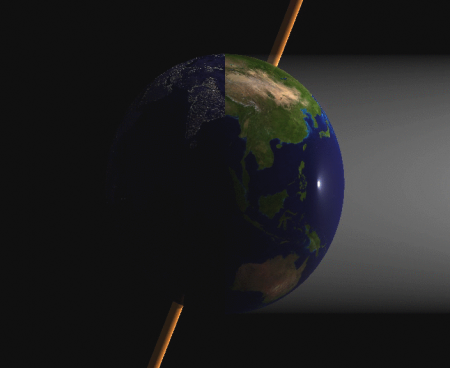
Demonstrating the axial tilt of the Earth, this image shows the Earth at the northern hemisphere's summer solstice.
Rotating Earth at the northern hemisphere's winter solstice.

You build 3d models in POV-Ray and then export 2d images from whichever point of view you want, so once you have the model set up you can easily change the perspective or even move objects to create animations.

POV-Ray does not have any useful sort of user interface; you’re usually creating your models with computer code. It can therefore be challenging to use, and, as with any 3d programming language, a bit of geometry, trigonometry and algebra are needed.

However, the final results can be impressive. I’m continually amazed each year by the quality of the work added to their Hall of Fame.

For much easier, quicker and not so sophisticated 3d results, I use VPython, which is also a great way to learn programming that outputs 3d images.

On Rabbit Digestion

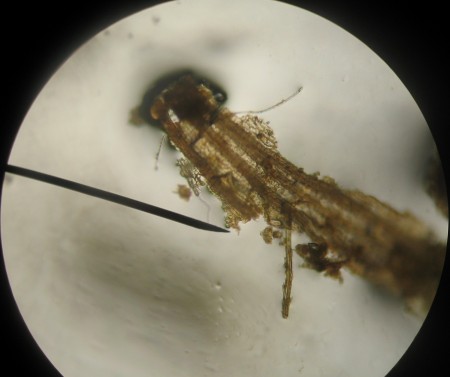
Figure 1. Undigested fiber from rabbit fecal pellets.

One of my favorite things is when my students teach me something I didn’t know. One of those things is that rabbits eat their own poop.

Well not exactly. According to Dana Krempels, from the University of Miami, rabbit fecal pellets (poop) are different from the other type of droppings that lagomorphs actually eat, which are called cecotropes (Kempels, 2010; Rabbits: The Mystery of Poop). Cecotropes apparently have lots of helpful bacteria and nutrients. Rabbits that don’t get to eat them tend to suffer from malnutrition.

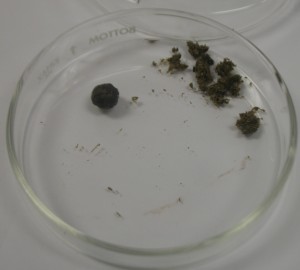
Figure 2. Rabbit fecal pellets, with one mostly dissected, in a standard petri dish.

Independent Research Project

For her Independent Research Project (IRP) this term, one of my students researched rabbits, and, as was required, tried to find them on our nature trail. She found indirect evidence. Small fecal pellets in the grassy area next to the trail’s exit, just where her research said they might be (which was quite nice). The pellets were brought inside, dissected, and examined under the microscope (see Figures 1 and 2).

The magnified image showed what appeared to be a partially masticated (chewed) piece of fiber, probably grass. This is where I was informed about the double eating called cecotrophy. My student hypothesized that this sample might be something that had not been fully digested and the rabbit would come back and eat it another time.

The Scientific Process

I really like the scientific process that went into this project, even though I’m not sure I agree with the final hypothesis. The project started with background research that yielded a plan for field observation. The field observation resulted in samples being collected and returned to the lab for analysis. The analysis produced some interesting, enigmatic results, which lead to a proposed hypothesis that integrated the observations based on the original background research.

The only things I would like to add to this type of IRP is to have students include a detailed scientific sketch, much like the sketches of the early botanists and naturalists. I really like how these drawings integrate acute observation and artistic interpretation.

Mariner AO: Discovering the Americas

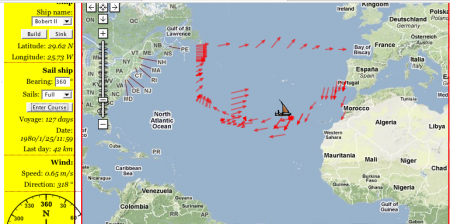
The route of the good ship Bobert II.

We just used my sailing game, Mariner AO, to help wrap up the group presentations on the European exploration of the Americas, and it worked wonderfully!

The small groups did their presentations timewise, starting with the Vikings (don’t ask me about Leprechauns), then the Spanish, the French (don’t ask me about giant sharks and flying pigs), and finally the English. At the end, we had half an hour left, but instead of just tying it together with a graphic organizer, I wanted to show them Mariner AO because the North Atlantic wind circulation ties in so wonderfully well with the pattern of colonization.

I started trying to show it off as a group, having them tell me which direction to sail the ship to get to the Americas. As you could probably predict that didn’t work particularly well. Everyone was yelling out directions at cross-purposes; however, it did give me the chance to show them all how the game worked.

Even with all the confusion the group seemed to like the game. Someone even suggested, “Why didn’t we do this for group work.” And I though, “Why not?” So the class broke apart for 25 minutes to see who could discover America first.

There was a lot of excitement in the room. I offered them extra points for the team that reached America first. They all know how empty that reward is by now so I think most of the excitement really came from being able to play a game with a little bit of competition.

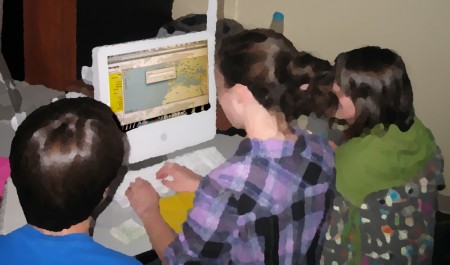
Building a ship to try to discover America.

The website still has a few bugs, especially on our older computers, but it worked. Three of the four groups reached the Americas, though two of them landed on the Canadian coast. The third group may well have ended up there as well, but I dropped a hint about Columbus’ route that sent them sailing into the Caribbean.

At least two kids planned on trying it at home. I had to pry one of the groups away from the computer so they could get their end-of-the-day jobs done on time.

We took screen captures of routes they took, and tomorrow we’ll put it all together, talk about the trade winds, what Columbus knew, and why the Iberians colonized South America while the French and English ended up mostly in the North.