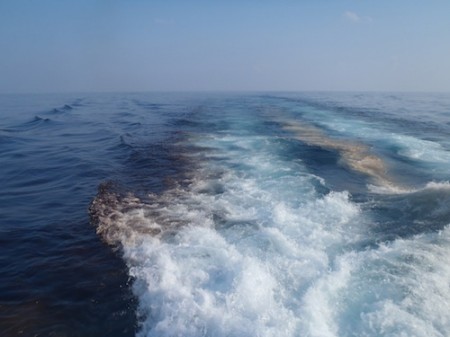
NASA’s Perpetual Ocean visualizations are excellent animations of the oceans’ surface currents.
Tag: oceanography
Heat and Hurricanes
What could possibly go wrong?
— Kai Ryssdal (2011) in Freakonomics: Preventing a hurricane on Marketplace by American Public Radio.
In what one can only hope is an extremely tongue-in-cheek article, Marketplace discusses how we might geoengineer a solution to stop hurricanes forming.
Hurricanes get their energy from the warm surface waters in the tropics. The warm water evaporates, transferring heat from the oceans to the atmosphere as latent heat in the form of water vapor. As the air rises, the water vapor condenses to form water droplets (clouds) releasing the stored heat into the air, causing the air to rise faster, sucking up more moisture, and setting up a positive feedback loop that turns storms and hurricanes.
But they need a constant supply of warm water.
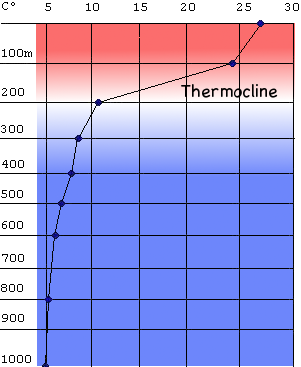
Unfortunately for the storms, the warm water in the tropics is only a thin layer, a couple of hundred meters deep, that sits above about 3,000 meters of colder deep-water. As the storms suck up the heat and moisture, they stir the oceans, cooling down the surface water, and leaving cooler water in their wakes. The cooler water means that subsequent storms have access to less energy.
The energy in the atmosphere and oceans “wants” to distribute itself evenly over the surface of the Earth. Hurricanes are just one violent means of moving heat from the tropics to the poles, and from the surface to the depths of the oceans.
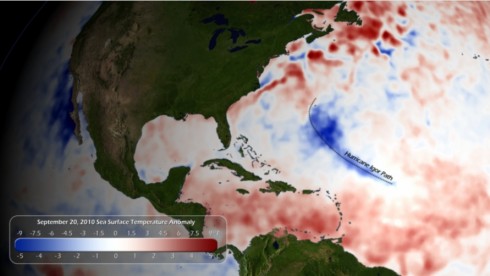
NOAA’s National Hurricane Center monitors sea-surface temperatures closely: it’s one of the key factors that go into their predictions of how bad the hurricane season is going to be, and what path a storm might take.
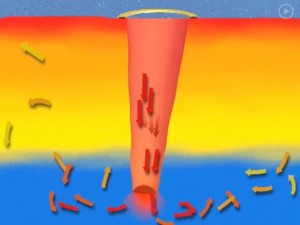
The suggestion in the Marketplace article is that we could build about 10,000 long tubes (called Salter Sinks) to connect the warm shallow surface water to the colder water below the thermocline. Wave energy at the surface would drive the warm water downward, causing mixing that would reduce the temperature of the surface water the storms feed off.
The devices might cost tens of millions of dollars per year, but that would be a lot less than the cost in property damage alone of a large storm like Irene, not to mention the loss of life it would prevent.
Apart from the “benign” environmental impact (according to Stephen Dubner) the only real question left is:
What could possibly go wrong?
The Thermal Difference Between Land and Water

The continents heat up faster than the oceans, and they cool down faster too. You can see this quite clearly in the animation above: notice how cold North America gets in the winter compared to the North Atlantic. It’s why London has an average January low temperature of 2˚C while Winnepeg’s is closer to -20˚C, even though they’re at almost the same latitude. There are a few reasons for the land-ocean cooling differences, and they all have to do with how heat is absorbed and transported.
(1) Specific Heat Capacity. Water has a higher heat capacity than land. So it takes more heat to raise the temperature of one gram of water by one degree than it does to raise the temperature of land. 1 calorie of solar energy (any type of energy really) will warm one gram of water by 1 degree Celcius, while the same calorie would raise the temperature of a gram of granite by more than 5 degrees C. The Engineering Toolbox has specific heat capacities of common materials.
(2) Transparency. The heat absorbed by the ocean is spread out over a greater volume because the oceans are transparent (to some degree). Since light can penetrate the surface of the water the heat from the sun is dispersed over a greater depth.
(3) Evaporation. The oceans loose a lot of heat from evaporation. In the evaporative heat loss experiment, While there is some evaporation from wet soils and transpiration by plants, the land does not have anywhere near as much available moisture to cool it down.
(4) Currents. Not only do the oceans absorb heat over a greater depth, but they can also move that energy around with their currents. The solar energy absorbed at the equator gets transported towards the poles, while the colder polar water gets transported the other way. Currents help average out ocean temperatures.
Live from 1500 Meters Deep
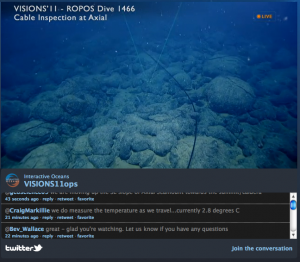
Live science. The remotly operated submersible ROV ROPOS is surveying an undersea cable recently laid across the the Juan de Fuca midocean ridge.
This scientific expedition will be going on until the end of August, and there’ll be live feeds every time the rover is deployed (which depends a bit on the weather at the surface).
If you have questions, they’re also answering your tweets.
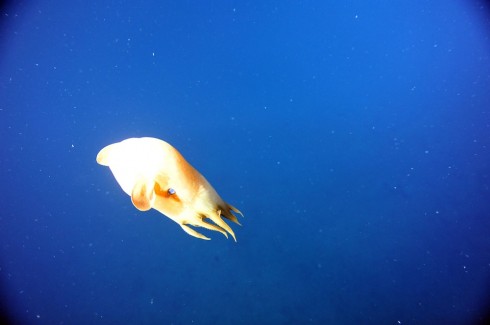
Right now, the rover’s heading toward the caldera of the axial seamount volcano. It should get there some time tonight (if they don’t have to stop for anything). So far, we’ve seen dumbo octopuses, crabs, weird fish, brainless worms, sponges, deep sea corals, starfish and lots of pillow basalt. The basalts are unsurprising because these are the rocks produced when volcanos erupt under water.
Blind Sampling of the Subsurface
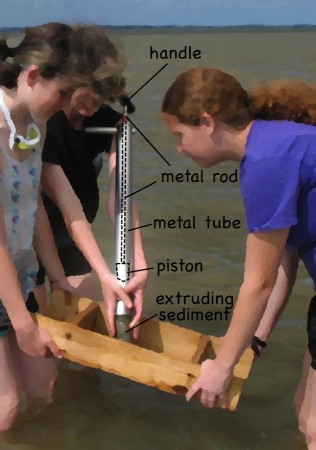
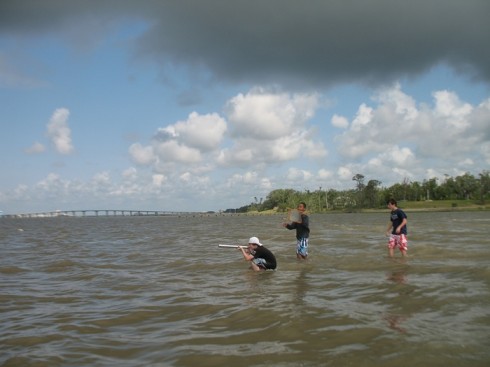
On the first morning of the Coastal Science Camp, between dip netting and seining at the estuary, we tried sampling beneath the seabed using a little coring device which I seem to have to forgotten the name of.
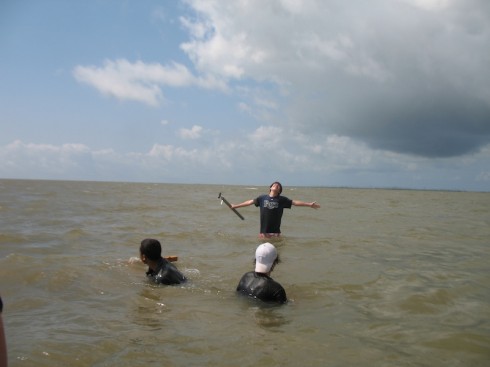
Usually, they can see the little holes in the seabed where the benthic macrofauna live, but not this time. All the sediment pouring into the Mississippi Sound from this spring’s swollen rivers had made the waters too turbid to see through. So we were coring blind.
The corer is simply a metal (stainless steel) barrel with a rubber piston inside. The piston is connected to a handle at the top with metal rod. To sample, you put the tip of the barrel at the sediment-water interface and push the barrel into the sediment at the same time holding the handle steady to keep the piston from moving into the sediment. Holding the piston steady provides a little suction on the inside of the barrel, which helps the barrel move into the sediment, and keeps the sediment in the barrel when you pull it out. However, it does help to put your hand on the bottom of the barrel as soon as possible to keep the sediment from falling out, even if that means sticking your hand into the sediment itself.
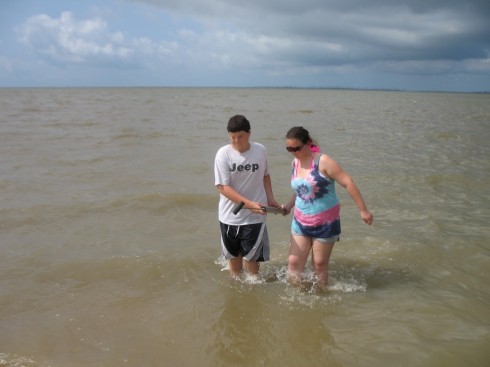

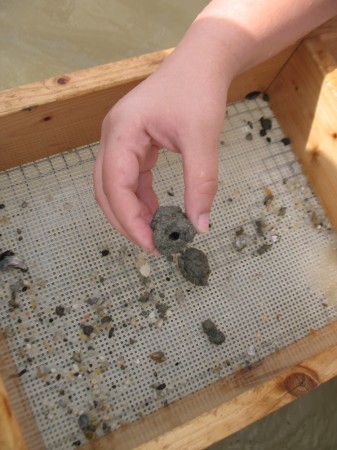
Once you’ve recovered the sediment, you extrude it into a sieve. Sometimes you can see a little layering in the extruding sediment, but we did not take the time to try to interpret it since our focus was on finding benthic fauna.
The sieve’s mesh is pretty coarse, so anything sand sized or smaller is washed out as you gently rock it back and forth in the water. We did not find much. Mostly small pebbles. Without being able to see the seabed our sampling pattern was pretty random.
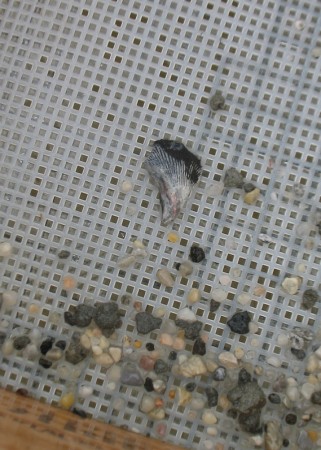
The more persistent groups (the class had been broken into groups of two or three) did find a couple things, including a polychaete, which is a segmented worm.
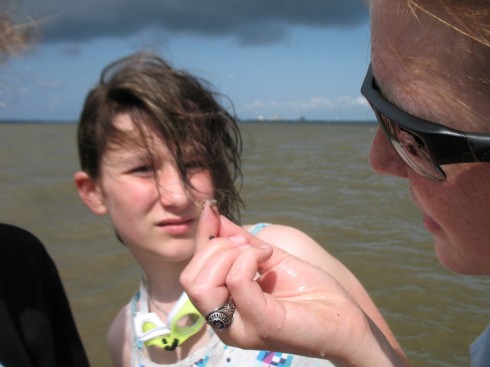
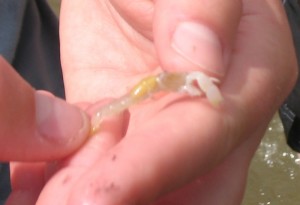
They also turned up a small, clawed, lobster-like organism:
We also found the burrow of an unknown organism, surrounded by a clayey cast. It looked very much like some of the fossilized burrow casts we saw at Coon Creek.
This type of sampling was not everyone’s cup of tea, however. Fortunately, the water was shallow and warm, so a good time was had by all.
Parting the Red Sea: Biblical Scenes from Space and Computer Modeling on the Earth
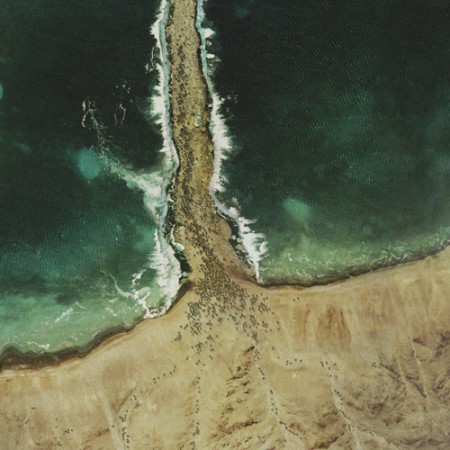
The Glue Society has a most interesting set of satellite images modified to look like major biblical scenes. CreativeReview has more pictures and details, including of the crucifixion and Noah’s Ark.
“We like to disorientate audiences a little with all our work. And with this piece we felt technology now allows events which may or may not have happened to be visualized and made to appear dramatically real,” say The Glue Society’s James Dive. “As a method of representation satellite photography is so trusted, it has been interesting to mess with that trust.”
— CreativeReview (2007): The Bible According To Google Earth
I think this topic came up when we were talking about atmospheric circulation. The question was about if the winds generated descending, diverging air could have parted the Red Sea. The answer was no, because the general atmospheric circulation system is a thing of climate — averages of the weather — while any winds strong enough to part the red sea would be actual weather, like the storms we seem to have been seeing every day for the last few weeks.
Oddly enough, just last year researchers from the University Corporation for Atmospheric Research (UCAR) did a computer model that showed that hurricane force winds from the northwest could have uncovered an underwater reef to allow Moses his passage (the article is Drews and Han, 2010).
However, the scientists found:
[The] reef would have had to be entirely flat for the water to drain off in 12 hours. A more realistic reef with lower and deeper sections would have retained channels that would have been difficult to wade through. In addition, Drews and Han were skeptical that refugees could have crossed during nearly hurricane-force winds.
— NCAR & UCAR News Center (2010): Parting the waters: Computer modeling applies physics to Red Sea escape route.
NPR’s article on the topic is worth a listen.
Tsunami
The tsunami spawned by the recent earthquake off Japan did most of the damage we know about so far. The U.S. National Oceanic and Atmospheric Administration’s Center for Tsunami Research uses computer models to forecast, and provide warnings about, incoming tsunami waves. They have an amazing simulation showing the propagation of the recent tsunami across the Pacific Ocean (the YouTube version is here).
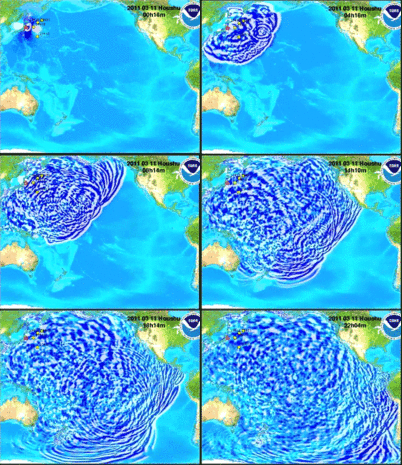
They’ve also posted an amazing graphic showing the wave heights in the Pacific Ocean.
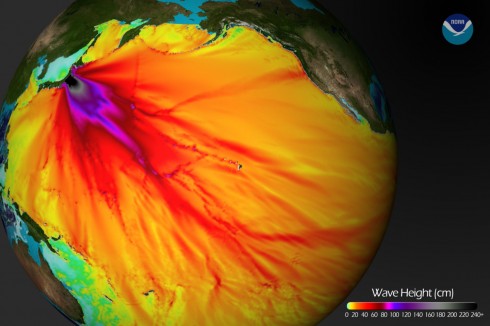
Of course, these are the results of computer simulations. As scientists, the people at NOAA who put together these plots are always trying to improve. Science involves a continuous series of refinements to better understand the world we live in, so the NOAA scientists compare their models to what really happen so they can learn something and do better in the future. Perhaps the best way to do this for the tsunami is by comparing the predictions of their models to the actual water height measured by tidal gages:

You’ll notice that NOAA did not do a perfect job. They did get the amplitude (height) of the waves mostly right, but their timing was a little off. Since it’s about 6000 km from the earthquake epicenter to Honolulu, being off by a few minutes is no mean feat. Yet I’ll bet they’re still working on making it better, particularly since some of the other comparisons were not quite as good.
Finally, if you were wondering, attempting to surf a tsunami is not a good idea. For one thing, there is no nice face to surf on:
… a tsunami wave approaching land is more like a wall of whitewater. …. Since the wave is 100 miles long and the tail end of the wave is still traveling at 500 mph, the shore end of the wave becomes extremely thick, and is forced to run far inland, over streets and trees and houses. …. And remember, the water isn’t clean, but filled with everything dredged up from the sea floor and the land the wave runs over–garbage, parking meters, pieces of buildings, dead animals.
— Natural Hazards Hawaii, University of Hawaii at Hilo: Why you can’t surf a tsunami
UPDATE: Terrifying video of the tsunami:
Scientists tracking oil plumes
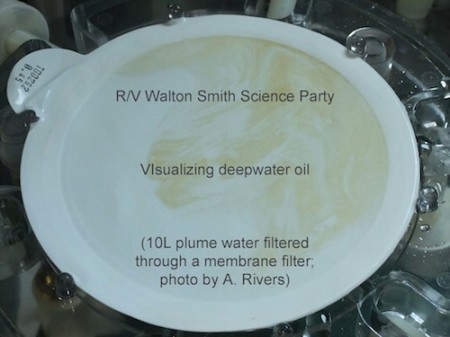
As oil continues to leak from the damaged well in the Gulf of Mexico and the surface slick is affecting more and more of the coastline, scientists now using research vessels to track the underwater plumes spreading at depth throughout the gulf.
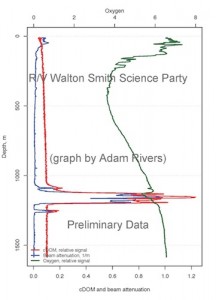
Satellite imagery from NASA only shows what’s at the surface. To find the underwater plumes, researchers on boats lower instruments on cables that measure the chemistry of the water. Certain chemicals, like colored dissolved organic matter (CDOM) are produced when there is a lot of oil in the water.
Dr. Samantha Joye, from the University of Georgia, is the lead scientist on one such vessel. She started the Gulf Oil Blog where she describes her ongoing work in the gulf and answers readers questions. It is an excellent resource. A great demonstration of science in action, working on a practical problem but using techniques and methods developed over time for answering more abstract questions.
