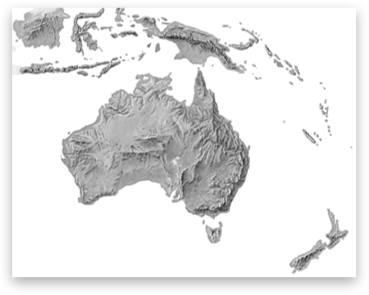
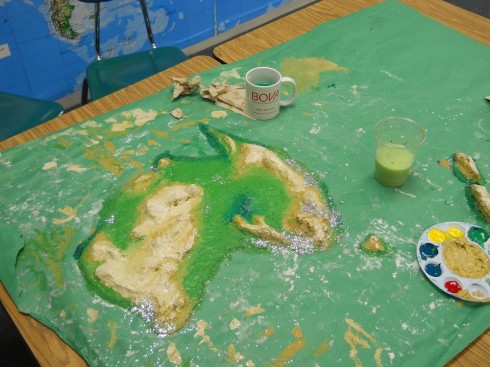
The Shaded Relief Archive is a great source of continental scale shaded relief maps. Dr. A. used them when the middle-schoolers built their 3d models of Australia and Antarctica for geography.
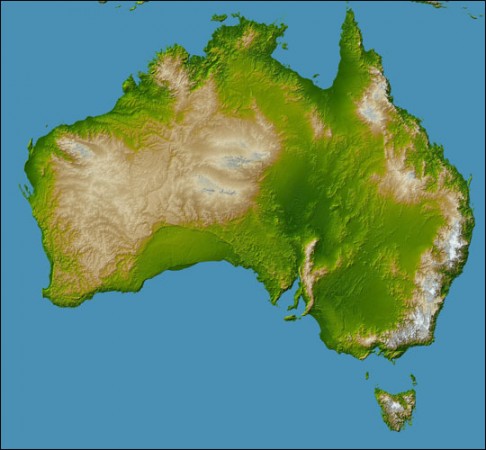
NASA’s Earth Observatory is another great source.
Middle and High School … from a Montessori Point of View

The Shaded Relief Archive is a great source of continental scale shaded relief maps. Dr. A. used them when the middle-schoolers built their 3d models of Australia and Antarctica for geography.

NASA’s Earth Observatory is another great source.

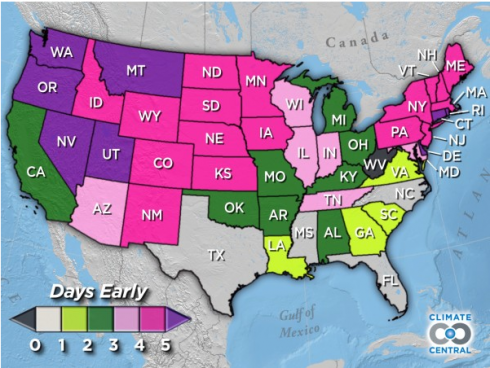
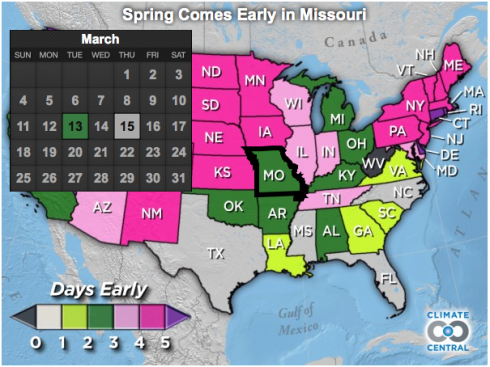
In Missouri, between 1981 and 2010 the average date at which trees first showed their leaves was two days earlier than the average between 1951 and 1980, according to this graphic by Climate Central.
You’ll also note the north-south trend, where change is greater as you go north. Most models predict that global warming/climate change due to increasing carbon dioxide will result in bigger changes as you get toward the poles.
The map is based on data from the National Phenology Network. The National Phenology Network has a good educational resource page, as well as access to their datasets.
