Understanding the Extinction of the Dinosaurs (and the Survival of Mammals)

This neat paper (Robertson et al., 2013) in the Journal of Geophysical Research makes an interesting attempt to explain the pattern of extinctions that occurred at the end of the Cretaceous: why most of the dinosaurs died out, and why ocean organisms were more severely affected than freshwater organisms by the long winter after the asteroid impact.

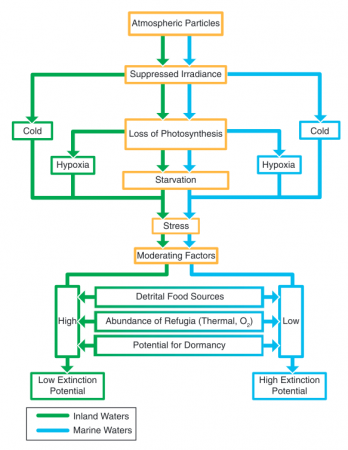
The flow chart explains:

Diagram of contrasts between freshwater and marine environments for factors potentially causing extinction in aquatic environments after the Chicxulub impact. (Image and caption from Robertson et al., 2013).

They also include an interesting figure showing how long an organism might survive based on how large it is, which I may be able to use in pre-Calculus when we’re discussing log scales and linearizing equations.

Allometric relationship between body size and time to death by starvation for multicellular poikilotherms in the absence of food (red, drawn from the equation of Peters [1983, p. 42]). Names of various types of organisms are shown as an indication of body size. Image and caption from Robertson et al., 2013.
Allometric relationship between body size and time to death by starvation for multicellular poikilotherms in the absence of food (red, drawn from the equation of Peters [1983, p. 42]). Names of various types of organisms are shown as an indication of body size. (Image and caption from Robertson et al., 2013.)

The article is written well enough that an interested high school biology student should be able to decipher (and present) it.

Caffeinated Seawater

Zoe Rodriguez del Rey tried to measure the caffeine concentration in the seawater off Oregon by measuring its concentration in mussels. It’s an interesting measure of just how the stuff we eat and drink can affect the environment. Curiously, del Rey and her colleagues found lower concentrations near the cities’ sewage treatment plants compared to areas further away from the cities.

Scientists sampled both “potentially polluted” sites—near sewage-treatment plants, larger communities, and river mouths—and more remote waters, for example near a state park.

Surprisingly, caffeine levels off the potentially polluted areas were below the detectable limit, about 9 nanograms per liter. The wilder coastlines were comparatively highly caffeinated, at about 45 nanograms per liter.

“Our hypothesis from these results is that the bigger source of contamination here is probably on-site waste disposal systems like septic systems,” said study co-author Elise Granek.

— Handwerk (2012): Caffeinated Seas Found off U.S. Pacific Northwest in National Geographic.

Evolution in Action

A fascinating study of 56,000 generations of bacteria, in 12 different populations, carefully documents how a new ability evolved in one of the populations — the ability to use citrate for food in addition to glucose.

About the key step in the process:

“It wasn’t a typical mutation at all, where just one base-pair, one letter, in the genome is changed,” he said. “Instead, part of the genome was copied so that two chunks of DNA were stitched together in a new way. One chunk encoded a protein to get citrate [for food] into the cell, and the other chunk caused that protein to be expressed.”

Evolution is as complicated as 1-2-3 from Michigan State University.

That was the second step in a three step process:

The first stage was potentiation, when the E. coli accumulated at least two mutations that set the stage for later events. The second step, actualization, is when the bacteria first began eating citrate, but only just barely nibbling at it. The final stage, refinement, involved mutations that greatly improved the initially weak function. This allowed the citrate eaters to wolf down their new food source and to become dominant in the population.

Note

I’ve been discussing different genres of scientific writing with my middle school class, so it’s interesting to point out that the article this post refers to is just a press release about the actual research paper. These are two very distinct types of scientific writing.
A Darwinian Debt

Evidence is mounting that fish populations won’t necessarily recover even if overfishing stops. Fishing may be such a powerful evolutionary force that we are running up a Darwinian debt for future generations.

— Loder (2006), Point of No Return in Conservation in Practice.

Darwinian Debt. That’s the elegant phrase Natasha Loder (2006) uses to describe the observation that human pressure on the environment — fishing in this particular example — has forced evolutionary changes that are not soon reversed.

Fishermen prefer to catch larger fish, depleting the population of older fish, and allowing smaller fish to successfully reproduce. Over a period of years this artificial selection — as opposed to natural selection — gives rise to new generations of fish that are permanently smaller than they used to be. And the fisheries find it hard to recover even after decades (Swain, 2007):

Populations where large fish were selectively harvested (as in most fisheries) displayed substantial declines in fecundity, egg volume, larval size at hatch, larval viability, larval growth rates, food consumption rate and conversion efficiency, vertebral number, and willingness to forage. These genetically based changes in numerous traits generally reduce the capacity for population recovery.

— Walsh et al., 2005, Maladaptive changes in multiple traits caused by fishing: impediments to population recovery in Ecology Letters.