CSI: TFS

Identifying the culprits using blood testing.

At the suggestion of Mr. Elder, I put together a Crime Scene Investigation (CSI) simulation for one of our afternoon interim activities. Sixteen students were challenged to solve a murder/mystery using simulated blood tests, fingerprinting, hair analyses, and chemical tests for drugs. And the assailants and the victims were members of the group.
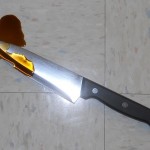
Knife at the crime scene.

I set up the crime scene with four different lines of evidence — fingerprints, hair, blood, and drugs — and forensic methods, so I could break my students up into four groups. The students were all told that they were competing to solve the mystery; to find out what happened and who did what to whom. Without any coaxing, the groups each claimed proprietary rights one type of evidence and set about trying to solve the mystery on their own. Since none of the lines of evidence could explain everything from the crime scene they ended up having to combine what they all found.
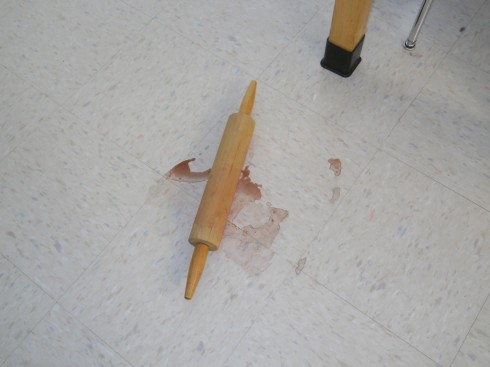
A blood soaked murder weapon (also with fingerprints and hair sample).

The Crime Scene

There were two weapons lying on the floor: a bloody knife and a bloody rolling pin with a hair stuck to it. On the table above the weapons were a few lines of white powder. There seemed to have been originally four lines, but one and one half of them had been used. There were fingerprints and a strand of hair next to the powder lines.

Also on the table, close to the powder, were a deck of cards (with fingerprints), a set of poker chips, a scale, and another stray hair.

Fortunately for our detectives, the fingerprints and hair had already been pulled and tagged.
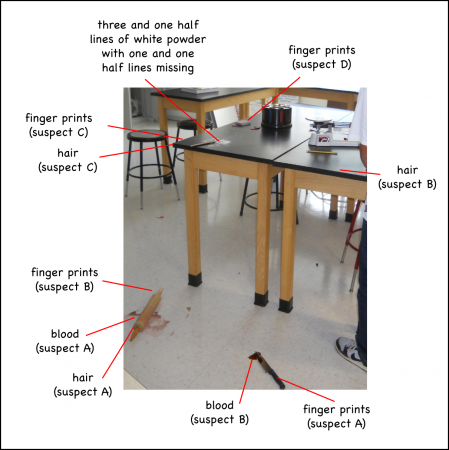
The crime scene setup.

Acquiring the Evidence

It took quite a bit of effort to acquire and plant the evidence. Some of it, like the blood, was simulated, but I had to get the hair and fingerprints from the students themselves. Since the individuals who chose this activity were a self-selected fraction of the middle and high-schoolers, I wandered around the building at lunchtime at the breaks between classes trying to find one or two students who were by themselves or were in a group with others who had not chosen the CSI activity.

The crime scene setup really only requires evidence of two people, but to keep it a little more mysterious I used a little misdirection. I got five students to contribute fingerprints and hair, but told them all that they’d be the murderer. I also got one person who was not in the class to contribute as well so we’d have a set of completely mysterious evidence.

Fingerprints

I pulled fingerprints by having students rub their fingers on a black spot I’d created using a basic number 2 pencil. The student would get the black graphite on their fingers and then touch their fingertips to the sticky part of some clear tape. The fingerprints turned out quite clearly that way.

Since I did not have time to figure out how to transfer the fingerprints to the surfaces I wanted them on, I just stuck the pieces of clear tape where I wanted them in the crime scene, which also saved the detectives a bit of time and effort.

Once I told them how to get the fingerprints from their peers, the students did not need any other guidance about how to analyze the fingerprints. They took the imprinted sticky tape and stuck them to a sheet of white paper, where the black prints showed up quite nicely. Then they fingerprinted everyone in the classroom and compared, looking for whirls and swirls primarily, but also basing their conclusions on the size of the prints which they took to be indicative of gender.
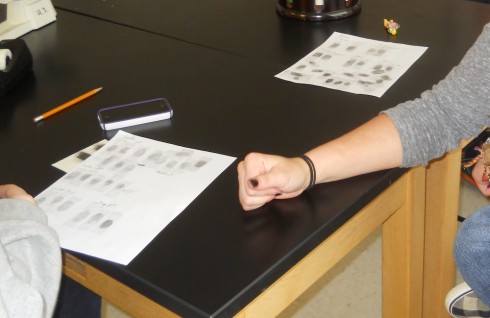
Comparing fingerprints.

Of the four sets of prints, they were able to accurately identify the two people who were holding the knife and the rolling pin. The misidentified the one set that was from a person not in the class, and could not find the match for the last set.

Interestingly, of the four students in the group, two did most of the work while the other two wondered off to join other groups.

Hair

Hair was easy enough to collect since the students were quite happy to donate one or two for the cause. One hair per student would have been sufficient, but I kept loosing them until I just decided I’d stick them onto a piece of clear sticky tape and leave the sticky tape with hair attached at the scene of the crime.
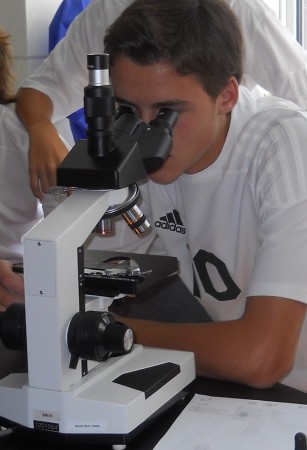
Examining hairs under the microscope.

With only a little nudging, the group working on the hair realized that they could get out one of the compound microscopes to examine their specimens, and compare them to the students in the class.

One major indicator that helped with the hair identification was the length. Two of the hair samples were from girls with long hair, while one was from a fairly short haired boy. I did consider just leaving pieces of the hair as evidence, instead of whole strands, but it’s a good thing I did not since, for one reason or another, the hair group had a difficult time identifying the owners of their samples (lack of effort might have been one part of it). It did help a bit that the two major perpetrators of the crime were members of that group.

Drugs

My idea here was to simulate a drug (cocaine) deal gone bad because of a contaminated/cut product. I laid out three lines of corn starch to simulate the cocaine and one line powdered glucose in between the last two cocaine lines to represent the adulterated drug. I removed the last cocaine line and half of the glucose line to make it look like someone had been ingesting the lines and stopped part-way through.
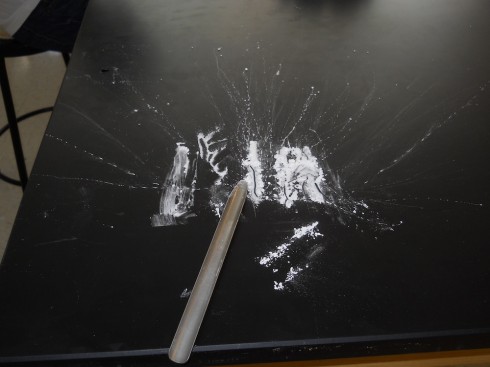
The lines of powdered substance (cocaine) were severely disrupted by student's sampling, but you can still see the two full lines to the right and the half line that the spatula is touching.
The lines of powdered substance (cocaine) were severely disrupted by student’s sampling, but you can still see the two full lines to the right and the half line that the spatula is touching.

Since we’ve been testing for simple and complex carbohydrates in biology and chemistry classes I told the group testing the drugs that the test for cocaine was the same as the iodine test for starch: if you add a drop of potassium iodine to a starch solution then it turns black.

If the students had examined the drugs on the table closely enough they should have been able to see that the glucose line was different from the others; it was not as powdered (so the crystals were small but visible), and it did not clump as much as the corn starch. However, they did not, and I had to hint that they should perhaps test all the lines of powder instead of just the first sample they took.

When they discovered that one of the powder lines did not react with the potassium iodine, I told them that a common adulterant was sugar so they should perhaps test for that. One of the students remembered the Benedicts solution test, which they were able to easily conduct since I’d already had the hot water bath set up for them.
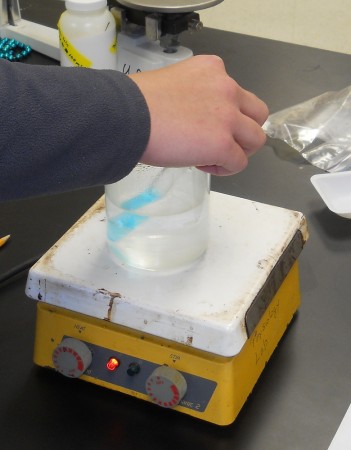
Testing for glucose.

Looking through the United Nations Office on Drugs and Crime’s Recommended Methods for the Identification and Analysis of Cocaine in Seized Materials, it seems that a common test for cocaine (the Scott test) turns a solution blue when the drug is present, so the next time I try this I may have to find some tests that produce a similar color change.

Blood/DNA testing

Simulating the blood testing was one of the trickier parts of the procedure for my part since I had to keep things very organized when students started being sent to me to be blood tested.

The blood was actually a few drops of food coloring diluted into 10 ml of water. I used three drops of red in each case to try to at least get it to a somewhat blood-like color, but then in mixed in one or two other colors to get five unique blood types.

The number of drops of food coloring mixed with 10 ml of water to get the 5 blood types.

  • Type 1: 3 red + 1 blue
  • Type 2: 3 red + 1 green
  • Type 3: 3 red + 1 yellow
  • Type 4: 3 red + 1 green + 1 yellow
  • Type 5: 3 red + 1 blue + 1 yellow

To match everything up with the crime scene, I assigned Suspect A to have Blood Type 2, and Suspect B to have Blood Type 4. So a sample of Blood Type 4 went on the knife, and a sample of Type 2 went on the rolling pin.

As a result, when the blood type testing group wanted to blood test everyone in the classroom, I had them send the students to me one at a time and I handed each student a small cup with a random sample of one of the Blood Types, except for the two students whose blood were on in the crime scene. With 16 students, we ended up with three or four students with each blood type.
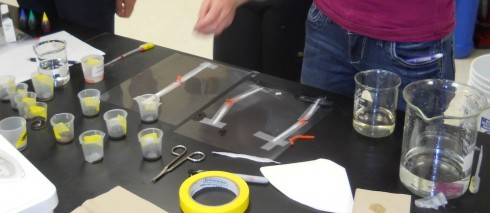
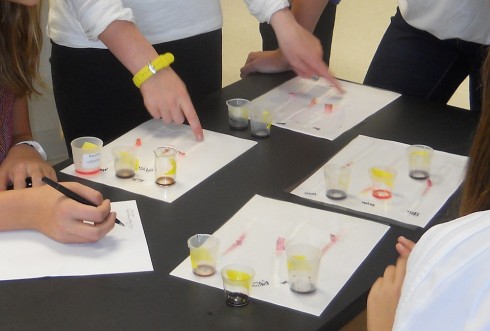
Blood type testing using chromatography.
Blood type testing using chromatography. The little containers of food coloring can be seen to the upper left.
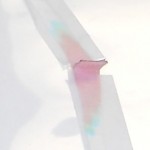
This blood sample -- from the rolling pin -- is beginning to separate into its constituent colors (red, yellow and blue).
This blood sample — from the rolling pin — is beginning to separate into its constituent colors (red, yellow and blue).

The students took their blood samples back to the testers who I’d shown a simple chromatography method. They’d cut out thin (< 1cm wide) strips of coffee filter, put a drop of the blood sample on the middle of the strip, and then taped it down to a sheet of clear overhead transparency film. Although any clear glass or plastic would have worked, the transparency film was nice because you could tape five coffee filter strips to one sheet and then loosely roll the sheet up and put one end into a partially filled beaker of water (see Figure above). Capillary action sucked the water up the strips and smeared out the blood samples so you could see its constituent colors. The method worked pretty well, and the students were able to compare the blood at the crime scene to their test results to identify the small group of people who shared the suspect blood types. It was a lot of work, and it would have taken much longer if the group doing it were not amazingly organized and worked extremely well together.

This method is more akin to blood type testing than DNA testing, which I’d have liked to simulate better, however I did not have the time to work on my chromatography method.

In Conclusion

It took a little coaxing to get them to the right conclusion in the end, but I and the student had a lot of fun solving the mystery.
From DNA to Proteins: A Simulation Game

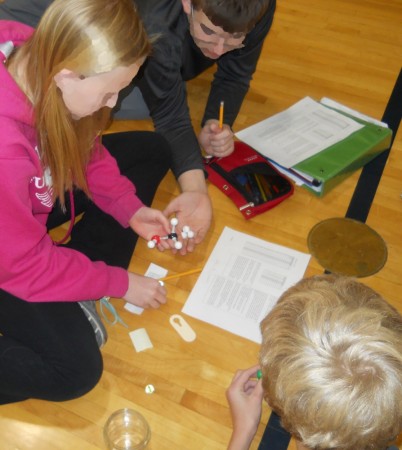
Figure 1. Students assemble a molecule after translating the instruction from the gene sequence.

Abstract

This simulation was designed to have middle school students practice reading instructions (proteins) from a sequence of genetic bases (DNA) to better understand how gene translation works and learn the types of things that proteins do. The exercise and discussion lasted 55 minutes (with one preparatory homework assignment). Students appeared to have a lot of fun doing the simulation (especially because of the competition between groups) and we had an excellent discussion afterwards.

Introduction

DNA holds the instructions that control what our bodies in the pattern of molecules (nucleobases) that make up our genes. The genes are located in the nucleus of our cells (as well as for all eukaryotes). When genes are expressed, they create proteins that actually get all the work done.

The jobs of proteins can be summed up a three things:

  • some proteins build structures like muscles,
  • other proteins are enzymes that catalyze reactions, like the breakdown of food in the digestive system, and
  • other proteins are used for sending messages.

Using the DNA Writer application for converting text into simulated DNA sequences, I create an exercise for students to practice:

  • Finding simulated genes in a DNA sequence
  • translating the genetic code into an instruction (a simulated protein)
  • performing the different types of jobs that proteins do.

The simulation was modeled as a competitive game, with the class of 7th and 8th graders broken into four groups that competed against one another to see who could complete the instructions the fastest. I cheated, I’m afraid, because what I did not tell them was that, in order to complete the last instruction, the groups would all need to work together, so there would be no single group winner.

Procedure

Pre-exercise Homework

Example Homework Assignment: HW-eg.pdf

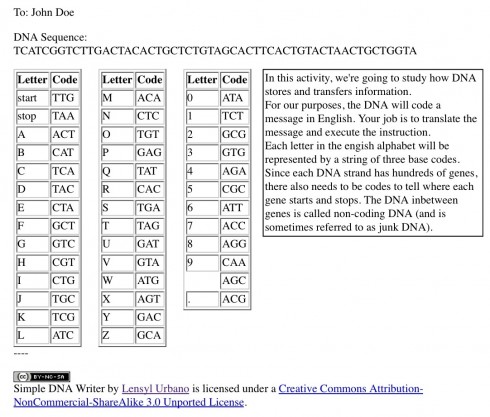
This being the first time I’ve tried anything like this, I was not sure how long it would take students to translate the DNA code to english, so a couple days before the simulation I handed out individualized homework assignments so they could practice. I chose science vocabulary words like “protein”, “ribosome”, and “amino acids” for short, simple messages.

Figure 2. This homework assignment consists of a simulated DNA sequence, the translation table, some instructions on how it works that comes from the DNA Writer app (use the printer friendly output option). The assignment can thus be individualized. This message translates as “amino acids”. Students were able to do the translation in less than five minutes. (pdf)

At least I had intended for it to be homework. As soon as they got the handout, and the 2 minute explanation about how it worked, they hashed out the messages in about five minutes.

The trickiest part was that the first few letters they translated did not make any sense, since they’re random sequences meant to represent non-coding DNA. However, once they got to the “start” codon it was pretty easy sailing.

Given how fast they were able to do the translation (and how eager and enthusiastic they were about it), I realized how unfounded were my fears that the translations would take too long for the competitive part of the exercise to work.

The Simulation/Exercise

Materials

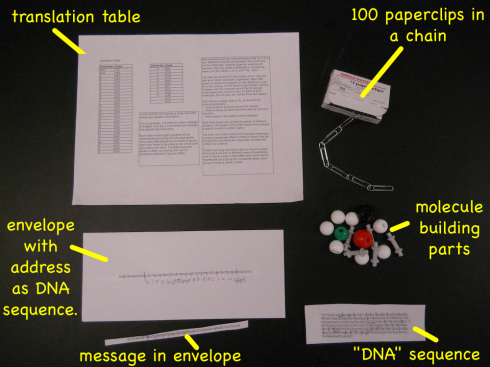
There are only a few materials required for this lab:

  • envelopes – one for each group (size does not matter)
  • a chain of paperclips (100 seemed to work pretty well) You only need one set of 100 because the groups will be working on this together.
  • enough parts of a molecule-building kit to make a methane molecule (CH4).
  • printout of the translation table (eg. HW-eg.pdf or from DNA Writer).
Figure 3. Materials and printouts used in this activity.

Preparation

For each group

  • Write out the main set of instructions. The instruction I used were:
    • PULL APART ALL THE PAPERCLIPS
    • BUILD A METHANE MOLECULE
    • BUILD A BUTANE MOLECULE
  • I used the DNA Writer to get the code for each instruction individually then stuck them together in a text editor (like Word) (Note: it might even be better to give them a bead string with the base sequence instructions). These three instructions together looked like this:

TATTGCACATTGGAGGATATCATCAGCACTGAGACTCACT
AGAGCACTATCATCAGCTAGCGTCTAAGCGAGACTGAGCT
ACACTCAATCCTGGAGTGATAACTCTCACTAGTATAGTCG
TTGCATGATCTGATCTACAGCACTAGCACACTATAGCGTA
CTCTCCTAAGCACATGTATCCTATCAGATATCCTATAATG
TCTATGCGTATCATTGCATGATCTGATCTACAGCACTAGC
CATGATTAGACTCTCCTAAGCACATGTATCCTATCAGATA
TCCTATAAGCAATCCACGCT

  • Write or print out an address label as a DNA sequence, and stick it on to the envelope.
    • Since my groups had already named themselves, my addresses were something along the lines of, “Give to Gryffendor”.
  • Write out a message and stick it into each envelope
    • My messages were things like: “Do 10 pushups”; or “Dance Gangnam Style”.
  • Do 10 pushups.
  • Chain together the paperclips:
    • The groups will be working together to pull apart the paperclips, so you want enough paperclips so that it takes a few minutes to do. This way the slower groups will have a chance to catch up with the faster groups.
  • Put the molecule building parts in a jar – one for each group.

Procedure

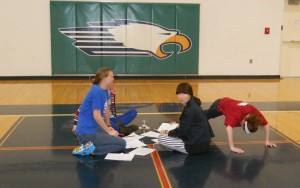
So I took the class to the gym and stuck each of the four groups on a side of the basket ball court. Each group had a jar of molecule parts (only enough to build a methane molecule), an addressed letter with a message in it, and the long DNA sequence.

The paperclips were in a box in the center circle of the court.

We gathered around the center circle for instructions, which basically consisted of me telling them they had to

  • deliver their message first,
  • then do the whatever was in the message delivered to them,
  • then follow the instructions in the long DNA sequence

They were eager to go.

Results

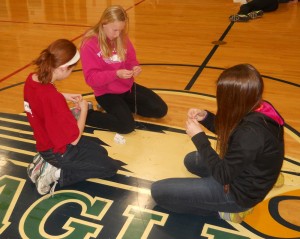
Methane molecule assembled.

The entire thing went remarkably smoothly, which was somewhat surprising since this is the first time I’ve ever tried anything like this.

It only took 20 minutes from the time they started to when they finally put together the butane molecule.

A few small issues did come up, however.

Since they had only ever decoded a single instruction from a single DNA sequence before, almost all the groups stopped after the first instruction on the long sequence (pull apart the paperclips). I had to point out that a real DNA sequence contains a whole sequence of genes, so they probably ought to continue translating.

Another group tried doing shortcuts, and when they saw that they had parts from the molecule building kit and the instruction was, “BUILD A M”, they assumed that they were just supposed to build any molecule. I had to intervene on that one too.

Figure 4. Each group contributed one person to pulling apart the paperclip chain. Pulling apart the paperclips represents the catalytic breakdown of long polymers in food (starches and proteins for example) by enzymes.

When the person from the third group arrived to help pull apart the paperclips, the two already there complained that more people would just slow them down. I had to point out that they could just break the long chain they were working on into smaller pieces and then everyone could work and the work would go a lot faster. The breaking of the chains is supposed to represent the catalytic effect of enzymes.

One group mistakenly blocked off the first two letters in the DNA sequence instead of the first three (for a codon), and couldn’t figure out why their sequence was not telling them anything. I had to help out with that one, but in our post-simulation discussion it reminded me to talk about transcription errors and how the genetic code can change.

Finally, they were, some more than other, sorely disappointed that there would be no winner. They so wanted to win that they did not want to share their molecule parts to build the butane molecule.

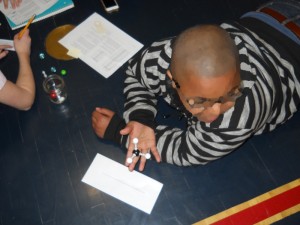
Figure 4. A student holds a butane molecule model.

Discussion

When we were done with the exercise, we gathered around in the center circle to debrief. We reviewed what DNA does and the three things that proteins do:

  • Assembling the butane molecule from the methane monomers represented the use of proteins to build structures.
  • Pulling apart the paperclips represented the breakdown of food in the digestive system. Starches, for example, are long chained polymers that are broken down into their constituent sugars by enzymes in saliva and in the stomach.
  • The envelope with the message was a very literal representation of proteins as message carriers.

I actually forgot to talk about the transcription errors one group was making during our circle discussion, so we ended up talking about it on the following day. One student had remembered the video I showed earlier about gene expression that compared the rate of errors in DNA encoding compared to computer disks. The DNA coding is much more reliable, but when billions upon billions of bases are being coded then errors will still creep in.

This lead to a discussion about mutations, and how some DNA transcription errors could give messages that made no sense and would be ignored, while others could send signals that could affect the body’s functions. The latter types of mutation can be good or bad.

Conclusion

The exercise went remarkably well. Key to it, I think, was the fact that the students were able to so efficiently translate the DNA code to English. Also, the instructions were designed to feed back into things they’d done in the past, like assemble covalent molecules and polymers.

The Middle School Bank and Trust: A Personal Finance Simulation

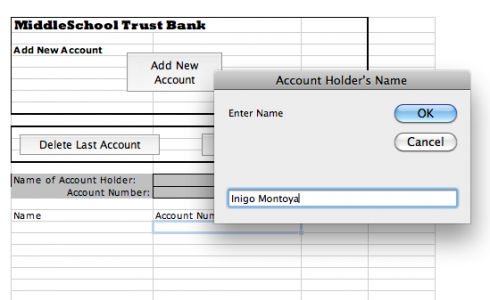
Excel program for running the Middle School Bank in the personal finance simulation. As you can see, I'm creating an account for my student, Inigo Montoya.

To get students a little more familiar with personal finance, we’re doing a little bank account simulation, and I created a little Excel program to make things a little easier.

It’s really created for the class where students can come up to the bank individually, and the banker/teacher can enter their name and print out their checks as they open their account.

Excel program for running the Middle School Bank in the personal finance simulation.

The front sheet of the spreadsheet (called the “Bank Account” sheet) has three buttons. The first, the “Add New Account” button, asks you to enter the student’s name and it assigns the student an account number, which is used on all the checks and deposit slips. The other two buttons let you delete the last account you entered, and reset the entire spreadsheet, respectively.

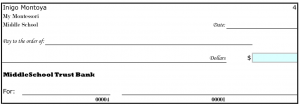
One of Inigo's checks (number 4).

Once you’ve created an account the spreadsheet updates the “Checks and Deposit Slips” sheet with the student’s name and account number. If you flip to that sheet you can print out eight checks and five deposit slips, which should be enough to get you through the simulation. The checks are numbered and have the student’s account number on them.

There are two other sheets. One is the “Checkbook Register”, which is generic and each student should get one, and the other is called “Customer Balances”. The latter is set up so you (the teacher) can enter all the deposits and withdrawals the students make, and keep track of it all on the same page.

Yes, it’s a bit of overkill, but I though that, since I was going through the effort, I should probably do a reasonable job. Besides, it gave me a chance to do a little Visual Basic programming to keep my hand in. While I teach programming using VPython (see this for example, but I’ll have to do a post about that sometime) you can do some very interesting things in Excel.

Note: I’ve updated the Excel file.

Kilobucks and capitalism

Well, it’s really kilobucks and economic systems, but that does not have the same rhythm for a title. We’re reprising the market versus socialist economies simulation game, my student came up with last year for his IRP.

I though I’d also include a little lesson on the metric system as a subtext. Hence the creation of the kilobuck. I’ll also talk about the centidollar, decidollar, decadollar and hectadollar.

One kilobuck, the official currency of the market versus socialist economy simulation game.

Using Chromatography as an Analogue for DNA Fingerprinting

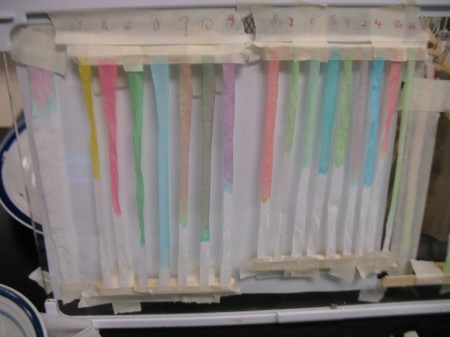
Color 'fingerprints', with four color standards labeled Y (yellow), R (red), G (green), and B (blue).
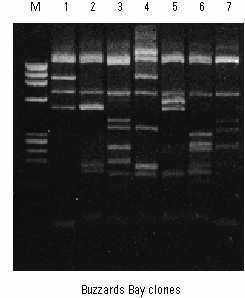
Gene sequences extracted from sediment in Buzzards Bay, MA, and separated using gel electrophoresis (Image from Ford et al., 1998)

One of the more basic techniques in the microbiologist’s toolkit is gel electrophoresis. It’s used to separate long molecules, like proteins, RNA and DNA from one another. Different organisms have different DNA sequences, so electrophoresis can be used to identify organisms and for DNA fingerprinting. Chromatography is also used to separate different molecules, usually pigments. Therefore, using some filter paper, food coloring, and popsicle sticks I created a nice little chromatographic fingerprinting lab exercise using chromatography as an analogue for electrophoresis.

Food colors and test tubes.

Using a standard set of four food colors (red, blue, green and yellow), I grabbed each students individually and had them add three drops of the colors of their choice to a test tube with 1 ml of water in it. One students went with three straight blue drops, but most picked some mixture of colors. I kept track of the color combinations they used, and labeled their test tube with a unique, random number.

When they’d all created their own “color fingerprint” in the test tubes, I handed them back out randomly, and gave them the key of names and color combinations (but no numbers). They had to find out whose test tube they had.

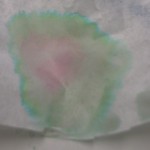
Diffusion of a drop of dye mixture through filter paper. At least three different colors are visible. The colors at the outer edge are the most difficult to distinguish.

I was kind enough to give them a few little demonstrations of chromatography I’d been experimenting with over the last day or so. The easiest technique is simply to place a couple drops of the sample on a filter paper (we used coffee filters “requisitioned” from the teachers lounge), and chase it with a couple drops of water to help the dye spread out. This method works, but since the sample spreads out in a circle, the inverse square law means that the separation of colors can be hard to see.

While the drop method worked well for most students, one who was a bit more analytically-minded, interested in the project, and had a particularly difficult sample, tried doing it using a filter paper column. Since I wanted to show them the proper way of conducting experiments, particularly about the importance of using standards, and I wanted to check if they were able to interpret their results correctly, I also did the full set of samples myself as columns. The standards are essential, because the green food color is actually a mixture of green and blue dyes.

Our color chromatography setup is as you see at the top of this post. We used popsicle sticks to keep the filter paper strips away from the glass surface.

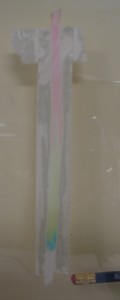
Experiment with filter paper taped to the glass.

The experiments worked well, and for best results, let the it dry because the colors show up better. One focus with my students was on note-taking and recording results; after a few iterations that worked out well too. Another nice aspect of using the series of columns is that it looks a lot like the electrophoresis bands.

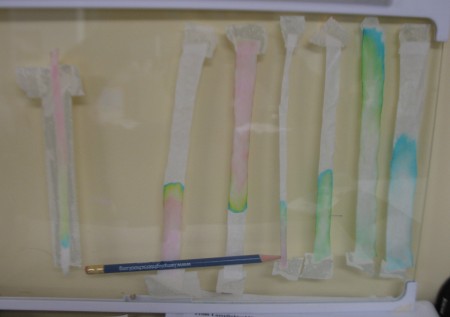
I did try some other variants of the chromatography: top down, bottom up and even taped down. The last version, where I taped the filter paper to the glass to create a restricted column, worked very well.

Variants of the experimental setup are shown in the three columns from left: taped down where the filter paper is taped to the glass; bottom up, where movement of the water and die is driven by capillary action; and top down, where the sample droplet is placed at the top of the column.