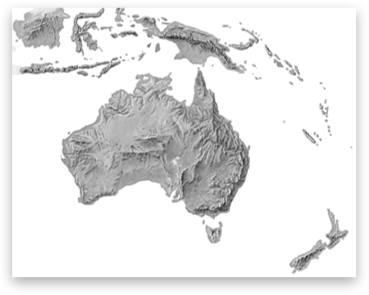
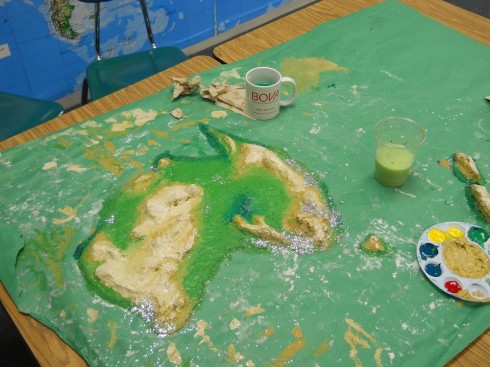
The Shaded Relief Archive is a great source of continental scale shaded relief maps. Dr. A. used them when the middle-schoolers built their 3d models of Australia and Antarctica for geography.
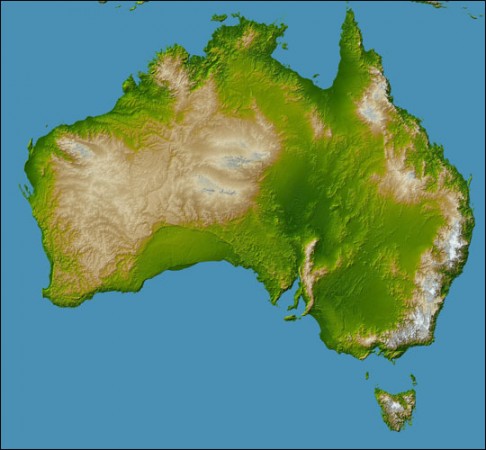
NASA’s Earth Observatory is another great source.
Middle and High School … from a Montessori Point of View

The Shaded Relief Archive is a great source of continental scale shaded relief maps. Dr. A. used them when the middle-schoolers built their 3d models of Australia and Antarctica for geography.

NASA’s Earth Observatory is another great source.

I’m not terribly partial to the Island of Podiatry exercise where student produce a map of physiographic features, gulfs, archipelagos, plateaus and so on, starting with the outline of their feet. However, in considering alternatives I was thinking about how it could be made even more real, more tactile. My first thought was of having them sculpt the topography out of modeling clay, but then I realized that this would be a great use for our sandbox.
The weather’s cooled down a bit in the last week, but it should still be warm enough for students to want to be outside. All I’ll need to do is level the box (though this might be no small feat since it’s filled with sand), add about ten centimeters of water, and have them shape the island from their Island of Podiatry map. I’ll also probably need them to decide whose map they want to model.
[googleMap name=”Lake Titicaca” description=”Example of a lake.” width=”490″ height=”400″ mapzoom=”7″ mousewheel=”false”]Lake Titicaca, Peru[/googleMap]
Cuing off of a comment by EV from Somewhat Up in the Air, I finally found what I think is a decent alternative to the Island of Podiatry map exercise. Instead of them altering a map of their feet into a series of topographic features, I’m having them do a treasure hunt using Google Maps. The assignment is pretty straightforward, and students can choose either option:
Use Google maps to capture images (Apple-Shift-4) of the features on the topographic features list. Put all the images into a PowerPoint or similar presentation. You may choose features from anywhere in the world so make it interesting.
The features list consists of: 1. Plain; 2. Valley; 3. Plateau; 4. Archipelago; 5. Ocean; 6. Isolated Mountain; 7. Mountain Range; 8. Lake; 9. Delta; 10. Strait; 11. Gulf; 12. Isthmus; 13. River; 14. Peninsula; 15. Bay; 16. Island; 17. Cape; 18. Hills.
In addition, I’d like to set up one of those games where they get extra points if the location they choose for a particular feature is not the same as someone else’s.
Another addendum to this, which would make a great extension to the project, is to allow students to enter the geographic coordinates of their features on a webpage that then plots all the similar features on a Google Map. It shouldn’t be too hard to do but would take some time as I’d have to set up and program its own website for the project along the lines of the Mariner AO site described here.
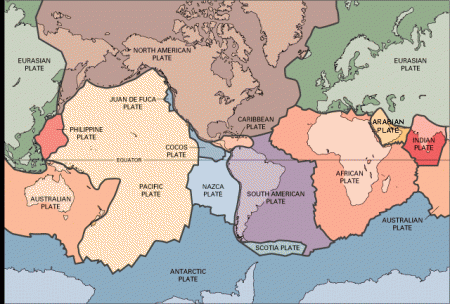
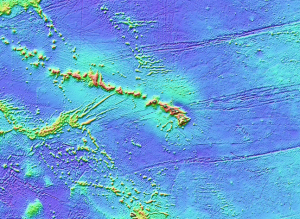
The question came up about where are good places for geothermal energy, and the answer, of course, was to introduce plate tectonics. It was a quick introduction, and a refresher for the 8th graders, but the interest was there and it seemed impactful.
It also provided a link to talk about the Icelandic volcano that’s been disrupting air traffic in Europe. NASA has an amazing picture of the eruption on its Picture of the Day for April 19th.
Google Maps is a great tool for showing features like the mid-ocean ridges (use the satellite view), zooming in and out of the mountain ranges, tracing the Hawaii hotspot and watching East Africa split apart.
[googleMap name=”Mozambique Channel” description=”East African Rifting” width=”400″ height=”350″ mapzoom=”4″ mousewheel=”false” directions_to=”false”]-21, 40[/googleMap]