Making Animations with HTML Canvas

Based off of Mozilla’s nice introduction to basic animations on the web, I made as simple of an animation as I could using the Canvas element in HTML. It just contains a static, red rectangle, and a green sphere that slowly moves across the canvas. This should serve as a simple introduction for my students who want to make online games.

<!DOCTYPE html>
<html lang="en" dir="ltr">
  <head>
    <meta charset="utf-8">
    <title></title>
  </head>

  <body>
    <div id="gameBoard"></div>

  </body>

  <script type="text/javascript">

    canvas_width = 400;
    canvas_height = 300;

    //create canvas
    cvs = document.createElement("CANVAS");
    cvs.height = canvas_height;
    cvs.width = canvas_width;
    document.getElementById("gameBoard").append(cvs);
    ctx = cvs.getContext("2d");
    cx = 10;
    cy = 20;

    window.requestAnimationFrame(animate);

    function animate(){
      //clear the canvas
      ctx.clearRect(0, 0, canvas_width, canvas_height); // clear canvas

      //set location of the circle
      cx += .2;
      cy += .1;
      
      //recreate the canvas (every time)
      ctx.fillStyle = '#ff0000';
      rect = ctx.fillRect(0, 0, 20, 100);

      ctx.beginPath();
      circ = ctx.arc(cx, cy, 10, 0, 2 * Math.PI);
      //ctx.stroke();
      ctx.fillStyle = '#00ff00';
      ctx.fill();

      window.requestAnimationFrame(animate);

    }

  </script>
</html>

This uses plain HTML and Javascript, with no additional libraries.
Updated Atom Builder

A couple of my students asked for worksheets to practice drawing atoms and electron shells. I updated the Atom Builder app to make sure it works and to make the app embedable.

So now I can ask a student to draw 23Na+ then show the what they should get:

Worksheet

Draw diagrams of the following atoms, showing the number of neutrons, protons, and electrons in shells. See the example above.

  1. 14C: answer.
  2. 32K+: answer.
  3. 18O2-: answer.
  4. 4He2+: answer.
  5. 32P: answer.

I guess the next step is to adapt the app so you can hide the element symbol so student have to figure what element based on the diagram.

An Online Microscope

Now that I have a new set of microscopes I didn’t think I would actually need to have an online, simulated microscope to show samples. However, I thought having a series of picture that I could scroll through would be useful to illustrate microscopy concepts such as depth-of-field when I talk about them to the whole class. Once I’d created the depth-of-field simulation, I figured it would not be too much extra trouble to put in a few different magnification levels. Now I have this embeddable online microscope simulator.

It’s started off with a single fly wing as a sample, but I’ll be adding to it as I take more pictures.

Depth of Field Demonstration: On a Simulated Microscope

At higher magnifications, microscope lenses will only be able to focus on layers within your specimen. You could take a series of images with different focal planes and stack them together, but without a camera mounted on the microscope, getting images to line up right for focus stacking is quite the challenge. The alternative is focusing in and out until you get a feeling for the three dimensional shape of the specimen.

Since I don’t have a camera mount I’ve created an html5/javascript page that simulates focusing in and out of a sample. It’s embedded above, but a direct link is here.

You can use the knobs to the right of the image to adjust the focal plane. You should be able to see hairs on the top and bottom of the transparent wing.

Basic JavaScript

One of my students couldn’t get VPython to install and run her computer. She was running Windows 8, and I have not used Windows, much less this version of it to figure out what the problem was. This is one of the challenges with a bring your own device policy. So, instead I gave the lesson on numerical integration using javascript.

To make things easier, I create a barebones template of a webpage build around javascript (using the jquery library to make interactivity easier).

If you open the webpage file (index.html) in your browser you should see nothing but the word “Hello”. The template is blank, but it’s ready so students can start with the javascript programming right away, which a few of my programming elective students have done.

For reference, this file (basic-jquery-numeric-int.zip) uses the template to create a program that does numerical integration. Someone using the webpage can enter the limits (a and b) and the number of trapezoids to use (n), and the program calculates calculates the area under the curve f(x) = -x2/4 + x + 4.

It’s a very bare template and doesn’t have any comments, so it’s not useful unless you’re at least a little familiar with html and javascript and just need a clean place to start.

Graphing Polynomials

Try it. You can change the order and coefficients of the polynomial. The default is the second order polynomial: y = x2.

I originally started putting together this interactive polynomial app to use in demonstrating numerical integration, however it’s a quite useful thing on its own. In fact, I’ve finally figured out how to do iframes, which means that the app is embeddable, so you can use it directly off the Muddle (if you want to put it on your own website you can get the embed code).

This app is a rewritten version of the parabola code, but it uses kineticjs instead of just HTML5 canvases. As a result, it should be much easier to adapt to make it touch/mouse interactive.

Atom Builder

This app lets you drag and drop electrons, protons, and neutrons to create atoms with different charges, elements, and atomic masses. You can also enter the element symbol, charge and atomic mass and it will build the atom for you.

Note, however, it only does the first 20 elements.

Learning the Periodic Table: A Prototype

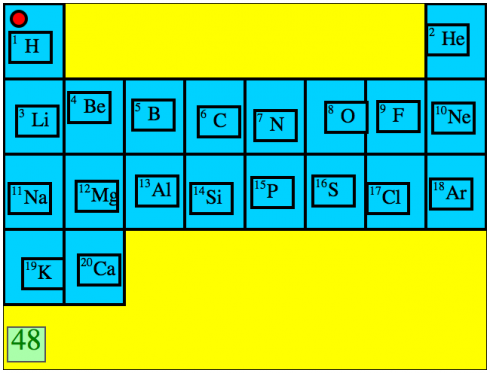
My middle school class is about to cover some very basic chemistry so I’ve asked them to memorize the first 20 elements in their correct order on the periodic table. To help, I’ve put together this interactive exercise where they drag an icon of the element to its correct place on the table. It says the name of the element whenever you start dragging a tile with the symbol. It’s also timed so students can quantify and compare how good they are.

Prototype exercise for learning the first 20 elements of the periodic table.

In this first prototype the elements are presented in order, but I figure that additional levels could have:

  • The elements come up at random (done).
  • Have the elements come up by vertical column (group) (done).
  • Instead of tiles with the elements, have diagrams with their electron configuration.
  • The program say the name of the element and the student has to click on the right cell in the table.

This was put together using HTML5 and Javascript. KineticJS was particularly useful. It should, in theory, work in any browser (but I have only tested it in Firefox and Google Chrome) and on touch-screen tablets as well.