Having just had the chance to teach the entire upper (secondary) school math curriculum, I’ve been doing a little bit of necessary reflection on how to help students get interested. One of the key things we learned in the Montessori training was just how much more students learn when they’re self-motivated about a topic.
The common theme among all these classes was the use of the math to construct models to better understand the relationships between different things.

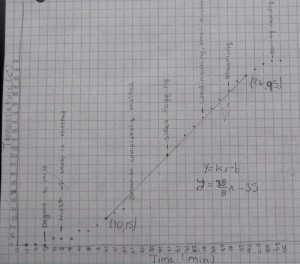
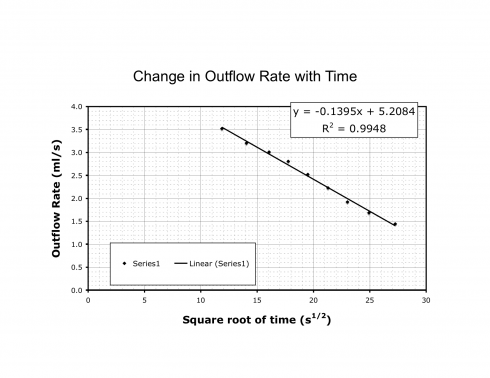
In Algebra I the focus is on linear models, like the one my middle schoolers drew from the results of their ice-melting experiment in science (see Figure 1). Another example (that I’ve not posted on yet) is calculating the density of liquids from a graph of volume and mass.
By the time they get to calculus they’re not just dealing with more complex functions, but they’re integrating and differentiating them to derive fundamental relationships.

![]()
Unfortunately, you usually end up with useful applications at the end of the book (or the chapter).
I wonder if it would not be more effective to put the examples in at the beginning. Not just in a little box for, “Why this is useful,” but start with the problem and then introduce the math need to solve it. A bit, perhaps, like Garfunkel and Mumford’s op-ed suggestion for more “real-life problems” in math education.