Randal T. Olson compares the sources of the petroleum the U.S.A. uses, to where people believe the oil comes from.

While Canada is our major supplier of oil, Americans tend to believe that the oil comes from Saudi Arabia and Iraq.
Middle and High School … from a Montessori Point of View
Randal T. Olson compares the sources of the petroleum the U.S.A. uses, to where people believe the oil comes from.
While Canada is our major supplier of oil, Americans tend to believe that the oil comes from Saudi Arabia and Iraq.

To start with chemistry class, we’re studying the properties of substances (like density) and how to measure and report concentrations. So, I mixed up four solutions of table salt (NaCl) dissolved in water of different concentrations, and put a drop of food coloring into each one to clearly distinguish them. The class as a whole had to determine the densities of the solutions, thus learning how to use the scales and graduated cylinders.
However, for the students interested in doing a little bit more, I asked them to figure out the actual concentrations of the solutions.
One group chose to evaporate the liquid and measure the resulting mass in the beakers. Others considered separating the salt electrochemically (I vetoed that one based on practicality.
Most groups ended up choosing to mix up their own sets of standard solutions, measure the densities of those, and then use that data to determine the densities of the unknown solutions. Their data is shown at the top of this post.

The variability in their results is interesting. Most look like the result of systematic differences in making their measurements (different scales, different amounts of care etc.), but they all end up with curves where the concentration increases positively with density.
I showed the graph above to the class so we could talk about different sources of error, and how scientists will often compile the data from several different studies to get a better averaged result.
Then, I combined all the data and added a linear trend line so they could see how to do it using Excel (many of these students are in pre-calculus right now so it ties in nicely):
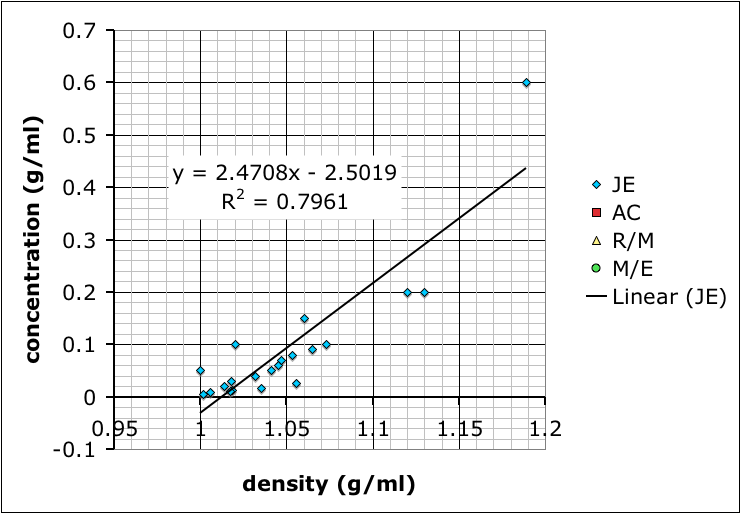
What we have not talked about yet–I hope to tomorrow–is how the R-squared value, which gives the goodness of the fit of the trend line to the data, is more a measure of precision rather than accuracy. It does say something about how internally consistent the data are, but not necessarily if the result is accurate.
It’s also useful to point out that the group with the best R-squared value is the one with only two data points because two data points will necessarily give a perfectly straight line. However, the groups that made more solutions might not have as good of an R-squared value, but, because of the multiple measurements, probably have more reliable results.
As for which group got the most accurate result: I added in some data I found by googling–it came off a UCSD website with no citation so I’m going to need to find a better reference. Comparing our data to the reference we find that team AC (the red squares) best match:


One of the assigned tasks from last summer’s guitar building workshop was to create a few modules for use in class. I worked on an assignment that has students calculate the volume of a guitar body using trapezoidal approximation methods that can be a bridge between pre-calculus and calculus.
The first draft of this module is here: volume-activity-v01.pdf (the LaTeX file is volume-activity-v01.tex.zip ). It has made contact with the enemy students and the results have so far been very good.

There were two things that I need to add for next time:

Finally, in addition, I also showed them how to quickly calculate the trapezoid areas once they’d entered the coordinates of each point on their graphs into Excel. I did not test them on this afterward, so I’m not sure how much of it they absorbed.
While our farm program is nascent and small, we’ve been trying to minimize the use of synthetic chemicals. Yet it would still be difficult and require a lot of paperwork to acquire an “organic” certification. One alternative that looks promising is the Certified Naturally Grown (CNG) program that uses peer certification (other CNG farmers do inspections) and has a much lower bureaucratic burden.
After all the time I spent working with Raspberry Pi microcomputers and Arduino microcontrollers this summer, it was interesting to see Claire Cain Miller summary of a PEW report on “AI, Robotics, and the Future of Jobs“.
Miller provides some interesting quotes from the experts surveyed for the report. One quote stood out in terms of its perspective on education and pedagogy:
“Only the best-educated humans will compete with machines. And education systems in the U.S. and much of the rest of the world are still sitting students in rows and columns, teaching them to keep quiet and memorize what is told to them, preparing them for life in a 20th century factory.”
— Howard Rheingold, tech writer and analyst .
The Key Findings from the PEW report provides a good summary of their results:
Half of these experts (48%) envision a future in which robots and digital agents have displaced significant numbers of both blue- and white-collar workers—with many expressing concern that this will lead to vast increases in income inequality, masses of people who are effectively unemployable, and breakdowns in the social order.
The other half of the experts who responded to this survey (52%) expect that technology will not displace more jobs than it creates by 2025. To be sure, this group anticipates that many jobs currently performed by humans will be substantially taken over by robots or digital agents by 2025. But they have faith that human ingenuity will create new jobs, industries, and ways to make a living, just as it has been doing since the dawn of the Industrial Revolution.
These two groups also share certain hopes and concerns about the impact of technology on employment. For instance, many are concerned that our existing social structures—and especially our educational institutions—are not adequately preparing people for the skills that will be needed in the job market of the future. Conversely, others have hope that the coming changes will be an opportunity to reassess our society’s relationship to employment itself—by returning to a focus on small-scale or artisanal modes of production, or by giving people more time to spend on leisure, self-improvement, or time with loved ones.
— Smith and Anderson, 2014. AI, Robotics, and the Future of Jobs.
The full report is worth a read.
An interesting article by some researchers from the University College in London describes the equation they constructed and tested that predicts happiness.
A key part of the equation is that it relates happiness to the difference between people’s expectations of rewards and the actual rewards.
… we show that emotional reactivity in the form of momentary happiness in response to outcomes of a probabilistic reward task is explained not by current task earnings, but by the combined influence of recent reward expectations and prediction errors arising from those expectations.
— Rutledge et al., 2014. A computational and neural model of momentary
subjective well-being, in PNAS Early Edition.

I wired a temperature sensor to my Arduino as part of the third project in the Arduino Projects Book. The project has the Arduino send the data to the serial port where the Arduino program (IDE) can show it. This data would be most useful to me, however, if it could be logged in a plain text file for data analysis. However, it’s a little annoying that there isn’t an easy way to save the data output by the Arduino.
So, I needed to use the terminal program “cat” to look at what was coming across the serial port. First I had to look up which port the Arduino was connected to in the Tools menu of the Arduino IDE: since I’m on a Mac, running OSX, this turned out to be something like /dev/cu.usbmodem411. (I could have looked this up by listing the contents of the /dev/ directory and then looking for anything connected to the usbmodem). To see the data I used:
> cat /dev/cu.usbmodem411
To actually save the data I directed the output of the cat command to the file data-log.txt:
> cat /dev/cu.usbmodem411 > data-log.txt
The contents of the file looked like this:
T25.68
6003,25.68
7504,25.68
Time (milliseconds), Temperature (deg. C)
0,25.20
1501,25.68
3002,25.68
4502,25.68
6003,26.66
7504,28.12
9006,30.08
10335,32.03
11663,33.98
12992,35.45
14321,36.91
15650,38.38
16979,39.84
18309,41.31
19559,42.77
20810,43.75
22062,42.77
23313,41.31
24563,40.82
25815,39.36
27144,38.87
28473,37.89
29802,37.40
31131,36.91
32459,35.94
33788,35.45
35118,35.45
36447,34.96
37776,34.47
39105,33.98
40434,33.98
41763,33.50
43091,33.01
44421,33.01
45750,33.01
47079,32.52
48408,32.52
49737,32.52
51066,32.03
52396,31.54
53724,31.54
I’m not sure what’s the deal with the first three lines, but if you ignore them you see the column headers (Time and Temperature) and then the time (in milliseconds) and temperature data) in a nice comma delimited format.
The Arduino program (sketch) that produced this output was:
const int T_sensor_Pin = A0;
const float baselineTemp = 20.0;
const int outPin = 4;

void setup(){

  Serial.begin(9600);
  pinMode(outPin, OUTPUT);

  Serial.println("Time (milliseconds), Temperature (deg. C) ");

}

void loop(){
  int T_sensor_Val = analogRead(T_sensor_Pin);

  float T_sensor_Voltage = (T_sensor_Val * 5.0)/1024.0;

  float T = (T_sensor_Voltage - 0.5) * 100;
  float T_F = (T * 1.8) +32.0;

  Serial.print(millis());
  Serial.print(",");
  Serial.println(T);

  delay(1500);

}
Based on the same Arduino sketch, you can write a Python program to read the data. This method enables you to use the data directly with VPython for visualization.
First you need to install the pySerial library (pySerial). Then you can read the serial data using:
data-log.py
import serial

ser = serial.Serial('/dev/cu.usbmodem411', 9600)

while True:
    print ser.readline()
You can also use CoolTerm to save the serial data (see directions on how).
Another alternative, is to get a shield that can hold an SD card (SparkFun and Adafruit have ones for less than $20) and write to that.
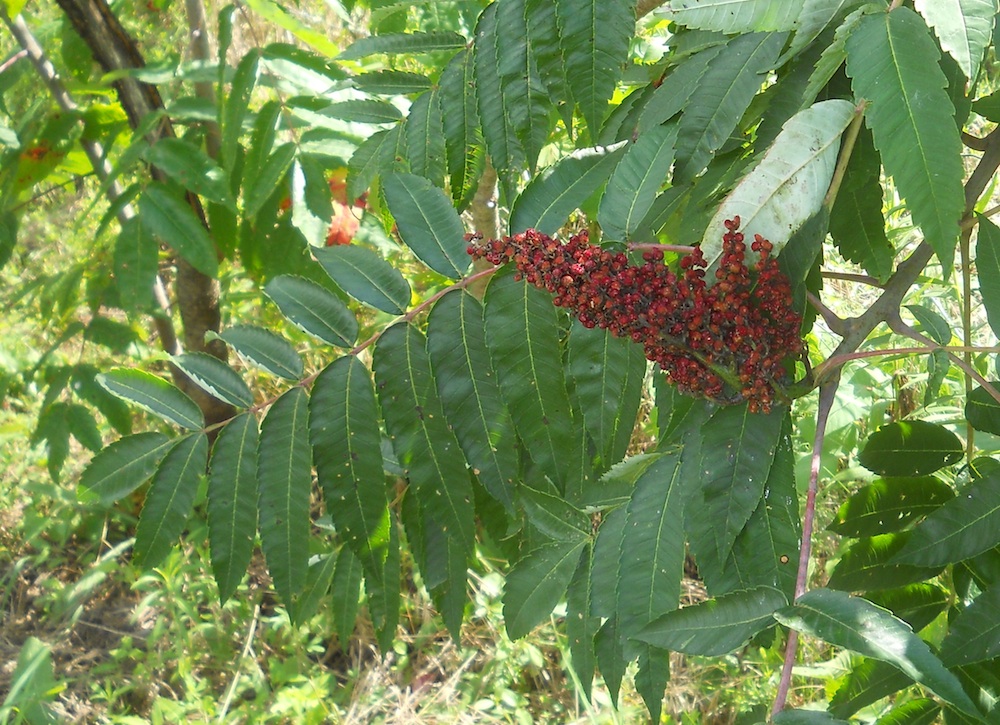
Ripe, bright-purple sumac berries are quite astringent. Steep a ripe bunch in a quart or two of hot water for a few hours (or cold water for a day) and the result is a tart tea. Add a third of a cup of sugar to make a delicious juice. (Note: Poison sumac is not found in Missouri, but it has been identified in adjacent, eastern states, so be careful.)