For a Statistics project, I took raw COVID data from John Hopkins University on May 20, 2020. With the data, I found the general statistics and then compared how cases are going up in Missouri every month.
| State | Confirmed | Deaths | Population | CasesPerCapita |
| Alabama | 13052 | 522 | 4779736 | 2.73069475 |
| Alaska | 401 | 10 | 710231 | 0.564605037 |
| Arizona | 14906 | 747 | 6392017 | 2.33197127 |
| Arkansas | 5003 | 107 | 2915918 | 1.715754695 |
| California | 85997 | 3497 | 37253956 | 2.30839914 |
| Colorado | 22797 | 1299 | 5029196 | 4.532931308 |
| Connecticut | 39017 | 3529 | 3574097 | 10.91660355 |
| Delaware | 8194 | 310 | 897934 | 9.125392289 |
| District of Columbia | 7551 | 407 | 705749 | 10.69927127 |
| Florida | 47471 | 2096 | 18801310 | 2.524877256 |
| Georgia | 39801 | 1697 | 9687653 | 4.108425436 |
| Hawaii | 643 | 17 | 1360301 | 0.4726895003 |
| Idaho | 2506 | 77 | 1567582 | 1.598640454 |
| Illinois | 100418 | 4525 | 12830632 | 7.826426633 |
| Indiana | 29274 | 1864 | 6483802 | 4.514943547 |
| Iowa | 15620 | 393 | 3046355 | 5.127439186 |
| Kansas | 8507 | 202 | 2853118 | 2.981650251 |
| Kentucky | 8167 | 376 | 4339367 | 1.88207174 |
| Louisiana | 35316 | 2608 | 4533372 | 7.790227672 |
| Maine | 1819 | 73 | 1328361 | 1.369356673 |
| Maryland | 42323 | 2123 | 5773552 | 7.330496027 |
| Massachusetts | 88970 | 6066 | 6547629 | 13.5881248 |
| Michigan | 53009 | 5060 | 9883640 | 5.363307445 |
| Minnesota | 17670 | 786 | 5303925 | 3.331495072 |
| Mississippi | 11967 | 570 | 2967297 | 4.032963333 |
| Missouri | 11528 | 640 | 5988927 | 1.92488571 |
| Montana | 478 | 16 | 989415 | 0.4831137591 |
| Nebraska | 11122 | 138 | 1826341 | 6.089771844 |
| Nevada | 7388 | 377 | 2700551 | 2.735738003 |
| New Hampshire | 3868 | 190 | 1316470 | 2.938160383 |
| New Jersey | 150776 | 10749 | 8791894 | 17.14943333 |
| New Mexico | 6317 | 283 | 2059179 | 3.067727478 |
| New York | 354370 | 28636 | 19378102 | 18.28713669 |
| North Carolina | 20262 | 726 | 9535483 | 2.124905471 |
| North Dakota | 2095 | 49 | 672591 | 3.114820151 |
| Ohio | 29436 | 1781 | 11536504 | 2.551552879 |
| Oklahoma | 5532 | 299 | 3751351 | 1.474668726 |
| Oregon | 3801 | 144 | 3831074 | 0.992149982 |
| Pennsylvania | 68126 | 4770 | 12702379 | 5.36324731 |
| Rhode Island | 13356 | 538 | 1052567 | 12.68897847 |
| South Carolina | 9175 | 407 | 4625364 | 1.983627667 |
| South Dakota | 4177 | 46 | 814180 | 5.130315164 |
| Tennessee | 18412 | 305 | 6346105 | 2.90130718 |
| Texas | 51673 | 1426 | 25145561 | 2.054955147 |
| Utah | 7710 | 90 | 2763885 | 2.789551664 |
| Vermont | 944 | 54 | 625741 | 1.50861139 |
| Virginia | 32908 | 1075 | 8001024 | 4.112973539 |
| Washington | 18971 | 1037 | 6724540 | 2.821159514 |
| West Virginia | 1567 | 69 | 1852994 | 0.8456584317 |
| Wisconsin | 13413 | 481 | 5686986 | 2.35854282 |
| Wyoming | 787 | 11 | 563626 | 1.396315997 |
The Table above is the raw data I extracted but I added the population of each state and then calculated the cases per capita by dividing the confirmed cases by the population. This allows you to compare each state equally.
After getting the raw data I did the statistical analysis on the confirmed cases and cases per capita.
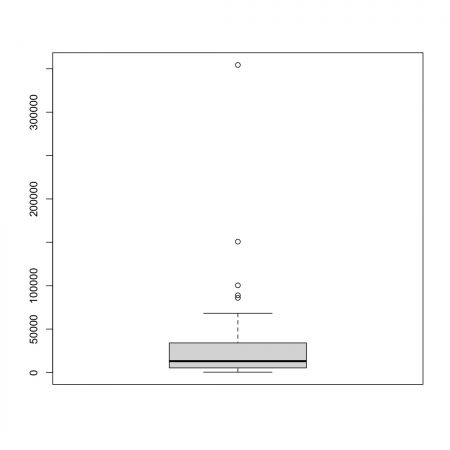
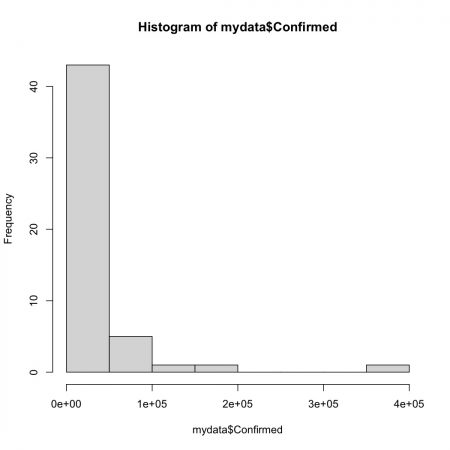
Confirmed Cases
| Min. | 401 |
| Q1 | 5268 |
| Median | 13052 |
| Q3 | 34112 |
| Max | 354370 |
| Mean | 30364 |
| Inter-Q | 28844 |
| Standard Div | 5513.53 |
| Missouri | 11528 |
| Missouri Z | -3.416323118 |
The data above is the analysis from the confirmed cases. The analysis is for all 50 states.
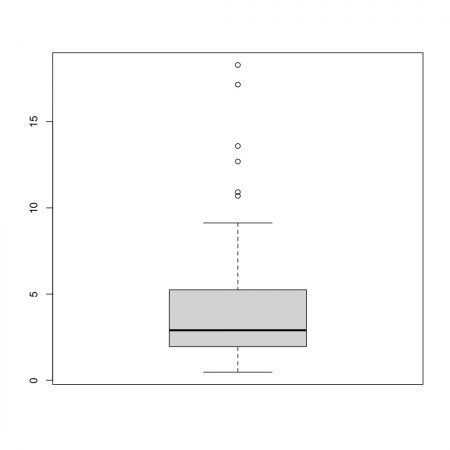
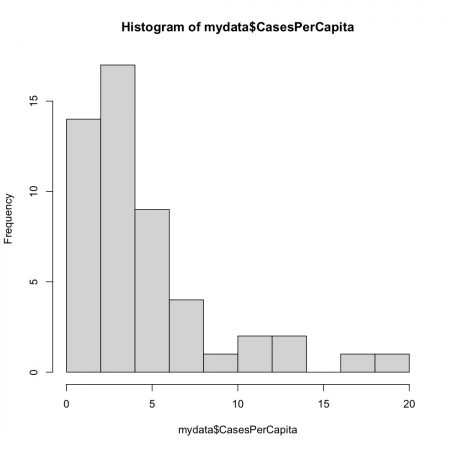
Confirmed Cases per Capita
| Min. | 0.4727 |
| Q1 | 1.9543 |
| Median | 2.9013 |
| Q3 | 5.2468 |
| Max | 18.2871 |
| Mean | 4.4639 |
| Inter-Q | 3.2925 |
| Standard Div | 4.101132 |
| Missouri | 1.92488571 |
| Missouri Z | -0.6191008458 |
The data above is the analysis from the confirmed cases per capita. The analysis is for all 50 states.
Missouri Predictions
After I did the analysis for all 50 states I focused on the rise of cases in Missouri from April to September. Then I predicted the number of cases in the future if the rise in cases stays the same. More than likely the cases will be higher or lower than the predicted number. If the state implements safety precautions the curve could flatten out. If the state does nothing and people keep taking it less and less seriously than more then likely the curve will get stepper.
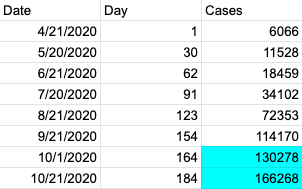
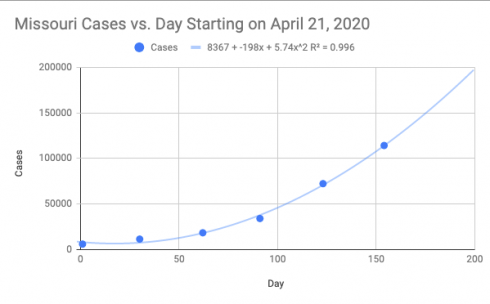
Above are the data and graphs I used to predicate the cases at the beginning of October and End. The two highlighted boxes are the predictions.
I predict there will be 130,278 cases in Missouri on the first of October. On the 21st I predict there will be 166,268 cases.