Beach Geomorphology on Deer Island

Figure 1: Beach profile on Deer Island spit.

The western end of Deer Island extends a white, sandy, artificial, spit that partially covers the first of a series of riprap breakwaters that protect the waterfront development of the city of Biloxi. Although we’d landed there to pick up garbage as part of our coastal science camp, the beautifully developed beach profile was worth a few minutes.

Figure 2: Narrow beach typical of the east-west trending shorelines that are not exposed to the direct force of the waves.

The spit curves just ever so slightly northward, so it feels more of the direct force of waves blown all the way along the length of Biloxi Bay. The combination of unvegetated sand and stronger waves makes the beach along the spit looks very different from the beaches that parallel the shore. While the parallel beaches on Deer Island are covered in grass almost to the water’s edge (Fig. 2), the spit has a much wider beach, with a nicely developed sandbar protecting a shallow, flat-bottomed, water-saturated trough behind it (Fig. 1).

While the white beaches are pretty (that’s why they imported this sand after all), there are a number of fascinating features in the trough.

Figure 3: On our Natchez Trace hike we found it quite easy to stick fingers into the red precipitate at the bottom of the stream.

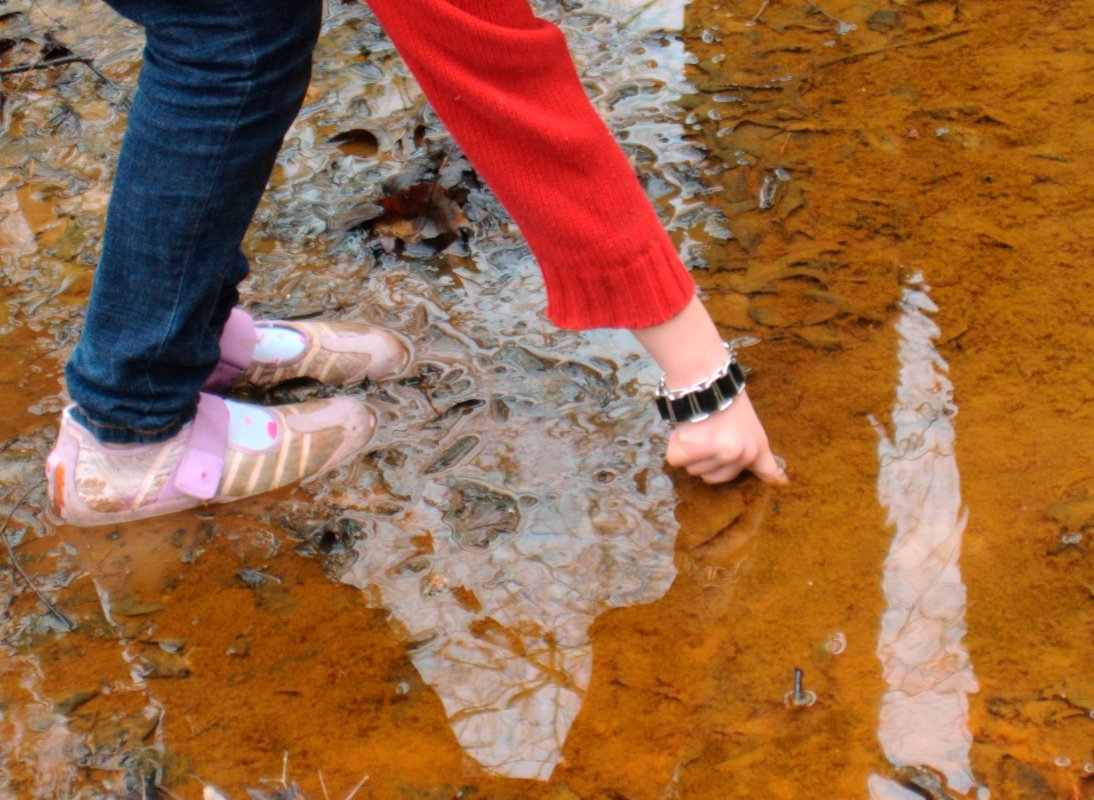
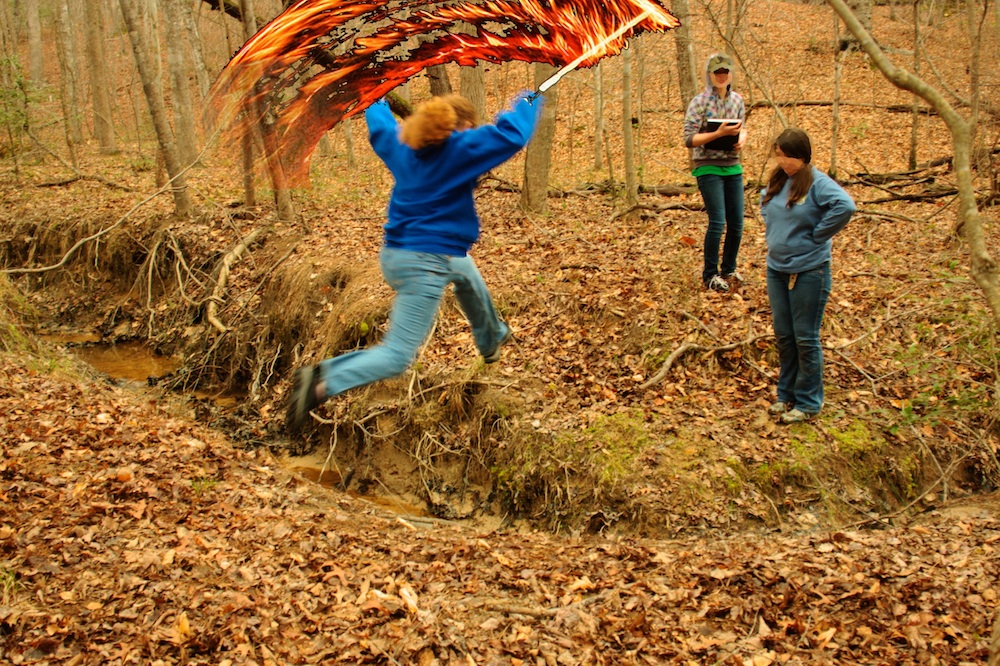
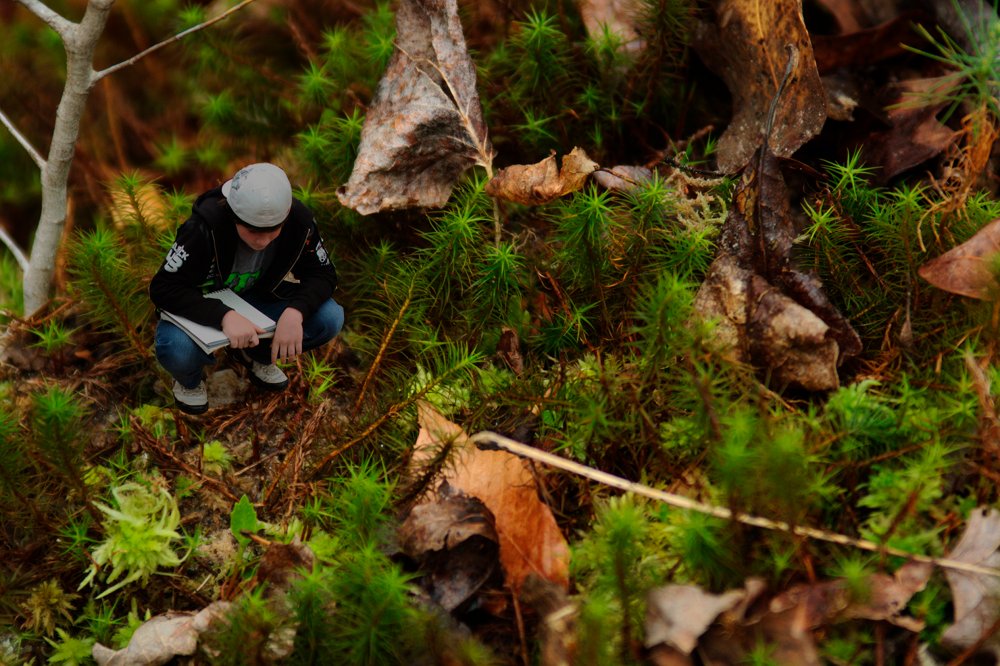
The first, and most obvious question is, why the reddish-orange color in the fine grained sediment at the bottom of the trough? A microscope and a little geochemical analysis would be useful here, however, lacking this equipment, we can try drawing parallels with some of our experiences in the past. In fact, we should remember seeing the same color in some of the streambeds when we were hiking in Natchez Trace State Park in Tennessee (Fig. 3). My best guess at that time was that the red was from iron in the groundwater being oxidized when it reached the surface.

Figure 4: The rich black of decaying organic matter, sits just beneath the rusty-orange surface sediement.
Figure 5: Green, organic matter, freshly deposited at the edge of the trough. If it decays while saturated with water it will turn black. Note also the splay of white sand at the top of the picture.

This is probably not a bad guess for the red in the trough as well, since there is some fresh groundwater discharge from the shallow watertable on the island. However, I suspect that the story is a bit more complex, because the rich black color of the organic matter just beneath the surface (Fig. 4) suggest that the shallow water and surface sediment in the trough is lacking in oxygen. On the other hand, it’s not uncommon to have steep geochemical gradients in boundary environments like this one.

The physical and geochemical gradients extend horizontally as well as vertically. At the edges of the trough the organic matter just beneath the surface is green, not black (Fig. 5), because this is the color of the undecayed algae.

At the seaward side of the beach, the waves of Biloxi Bay lap against the sand bar. When the tide rises, and the wind picks up, these waves wash over the crest of the sand bar pushing water and sediment over the top into trough. When the sand washes evenly over the top it creates thin layers (possibly one layer with each high tide). If you cut into these layers you’ll see little the laminations in profile, which, because the layering is close to horizontal, look like the lines of topography on a map (Fig. 6). When the waves wash over small gaps in the sandbar the sediment it transports is deposited in a more concentrated area – these are called sand splays – that overlap and cover some of the fine-grained, orange sediment at the edge of the trough. These are both two of the small ways that the sand bar moves, slowly pushing inland.

Figure 6: Sand splay and laminations on the landward side of the sand bar. The laminations are created by even overwash of the sandbar, while the splay is the result of more concentrated flow.

Bioturbation

The features on the bottom of the trough are a quite interesting because of the observable effects of bioturbation (disturbance by organisms) (Figs. 7, 8 & 9).

Figure 7: In close-up, the holes of the crabs and the mixture of colors looks like an arid, volcanic landscape photographed from space.
Figure 8. Digging deep beneath the orange surface sediment, small crabs create mounds of white sand.
Figure 9. Footprints of predators. Paleontologists use features like these that are preserved in rocks to discover interpret what the relationships between organisms was like in the past.

Surviving the Anthropocene

Styrofoam cup collected from the beach of Deer Island. The city of Biloxi sits in the background.

65 million years ago, an asteroid hit the Earth just off the Yucatan Penninsula, kicking up enough dust in to the atmosphere (and perhaps setting off supervolcanos) to lead to the extinction of the dinosaurs. Geologists mark this mass extinction event as the end of the Cretaceous period and the beginning of the Tertiary; it’s called the K-T boundary. Paleontologists see a rapid change in the forms of life fossilized in the rocks above and below the boundary. The element iridium, which is relatively common on asteroids, but rare on Earth, can be found in a thin layer of the fallout from the asteroid impact all around the world.

The Chicxulub Crater, believed to be the location of the K-T asteriod impact. Image from NASA: Short (2010)

Well, the Earth’s going through another mass extinction event right now. In fact, even if humans were to go extinct right now, the remains of our cities and our impact on the global chemical cycles, will leave a distinct signature that geologists millions of years from now will be able to detect.

Geologists refer to the last 10,000 years, the period starting when the Earth warmed after the last glacial maximum, as the Holocene. This time period saw the emergence of agriculture, the rise of human civilization, cities, nuclear weapons, the internet. Now, given the enormous environmental changes we’re wrecking on the planet, some say we’ve entered a new geologic epoch that they’re calling the Anthropocene.

The question is: How long will it last?

Regardless of your philosophy, the recognition that we have entered a geologic age of humanity raises the obvious question of just how long such an age will last.

In the infamous KT boundary geologists can see evidence for a rather short-lived event that also reshaped the planet. Sixty five million years ago an asteroid struck the Earth, driving one of only five mass extinctions in the planet’s history. The loss of the dinosaurs turned out to be an opportunity for our mammal ancestors and led directly to our own age.

Since the Anthropocene appears to mark a sixth great extinction, one has to wonder what it will take for us to make it out of own era with civilization intact.

— Frank (2011): The Anthropocene: Can Humans Survive A Human Age?

Government and Geology in Nashville

At the capitol building in Nashville.

Earlier this spring, we had an excellent immersion trip to Nashville. The primary purpose was to visit the capitol and meet with Memphis’ State Representative Mark Kernell.

State Rep. Kernell was kind enough to spend some time answering and asking questions of our students.

But we also had time to visit the Abintra Montessori School in Nashville (who returned the visit last month), and have an excellent hike along a limestone-bedded stream in Montgomery Bell State Park. The hike, however, was not without some controversy.

Bedding planes and joints.

Shilo and Pickwick Immersion

The Shiloh National Battlefield is only a couple hours east of Memphis (or west of Nashville), and its proximity to Corinth, MS, and a state park with a hydroelectric dam, make it an excellent place for an immersion trip during the cycle when we study the U.S. Civil War and electromagnetism. Two years ago, on a couple beautiful, sunny days in the middle of spring (early April), almost on the anniversary of the battle, we made the trip.

Paleozoic (?) (250-550 million years ago) fossils from Pickwick Landing State Park.

We drove over on a Tuesday morning, and since our very nice cabins at Pickwick Landing State Park were not quite ready yet, we ate the lunch we’d brought with us at a picnic shelter on the park grounds. The choice of picnic shelter number 6 was serendipitous, because not only was it beautifully located, but just down the hill, at the edge of the water, is an excellent outcrop of fossiliferous limestone.

After unloading at the cabins, we took a short, afternoon drive to see the hydroelectric dam.

Old turbine from the hydroelectric dam.

The next morning we hiked along the Confederate line of advance during the Battle of Shiloh.

Reenacting the Confederate skirmish line at Shiloh.
Confederate or Union?

It was a relatively long hike, but useful in that it allowed students a feel at least for the scale of the battle, and the conditions the soldiers endured. There was also a nice museum at the end, with an interesting video and an excellent demonstration from one of the park rangers (you need to book an appointment ahead of time).

Finally, on Thursday morning, on our way back to Memphis, we stopped at the Civil War Interpretive Center in Corinth, Mississippi. The museum is excellent, especially the Stream of American History, which is abstract enough that it makes a great puzzle for students to figure out.

Stream of American History.

The map below shows the locations of the stops, and has links to the posts about each stop.


View Shiloh Immersion in a larger map

Chasing Raindrops: A Hike in Natchez Trace State Park

In which we follow the path of a raindrop from the watershed’s divide to its estuary on the lake.

Droplets of water scintilate at the tips of pine needles. When they fall to the ground they continue their never-ending journey in the water cycle.

The most recent immersion. Coon Creek.

We stayed at Natchez Trace State Park and just a couple meters away from the villas is the head of the Oak Ridge Trail (detailed park map here).


View Natchez Trace Immersion Hike in a larger map

The first thing you notice is a small, rickety bridge whose main job is to keep your feet dry as you cross a very small stream. The stream is on its delta, so the ground is very soggy, and the channel is just about start its many bifurcations into distributaries that fan out and create the characteristic deltaic shape.

Delta and estuary of the small stream near the villas.

There’s a bright orange flocculate on the quieter parts of the stream bed. It’s the color of fresh rust, which leads me to suspect it’s some sort of iron precipitate.

It is quite easy to stick your finger into the red precipitate at the bottom of the stream.

Iron minerals in the sediments and bedrock of the watershed are dissolved by groundwater, but when that water discharges into the stream it becomes oxygenated as air mixes in. The dissolved iron reacts with the oxygen to create the fine orange precipitate. Sometimes, the chemical reaction is abiotic, other times it’s aided by bacteria (Kadlec and Wallace, 2009).

The bark has been chewed off the top half of this stick. The tooth marks are characteristic of beavers.

Past the small delta, the trail follows the lake as it curves around into another, much bigger estuary (see map above). We found much evidence of flora and fauna, including signs of beavers.

We even took the time to toss some sticks into the water to watch the waves. With a single stick, you can see the wave dissipate as it expands, much like I tried to model for the height of a tsunami. We also threw in multiple sticks to create interference patterns.

Observing interference patterns in waves.

The Oak Ridge Trail, which we followed, diverges from the somewhat longer Pin Oak Trail at the large estuary (which is marked on the map). The Pin Oak Trail takes you through some beautiful stands of conifers, offering the chance to talk about different ecological communities, but we did not have the time to see both trails.

Instead, we followed the Oak Ridge Trail up the ridge (through one small stand of pines) until it met the road. The road is on the other side of the watershed divide. I emphasized the concept by having my students stand in a line across the divide and point in the direction of that a drop of water, rolling across the ground, would flow.

At the watershed divide.

Then I told them that we’d get back by following our fictitious water droplet off the ridge into the valley. And we did, traipsing through the leaf-carpeted woods.

Students imitating water droplets find a dry gully.

Of course there were no water droplets flowing across the surface. Unless its actively raining, water tends to sink down into the soil and flow through the ground until it gets to the bottom of the valley, where it emerges as springs. Even before you see the first spring, though, you can see the gullies carved by overland flow during storms.

Spring.

Following the small stream was quite enjoyable. It was small enough to jump across, and there were some places where the stream had bored short sections of tunnels beneath its bed.

The stream pipes beneath its bed. Jumping up and down over the pipe caused sediment to be expelled at the mouth of the tunnel.

I took the time to observe the beautiful moss that maintained the banks of the stream. Students took the time to observe the environment.

Taking a break at the confluence of two streams.

Downstream the valley got wider and wider, and the stream cut deeper and deeper into the valley floor, but even the small stream sought to meander back and forth, creating beautiful little point bars and cut-banks.

A small, meandering channel. Note the sandy point bars on the inside of the bend, and the overhanging cut-banks on the outside of the curve.

As the stream approached its estuary it would stagnate in places. There, buried leaves and organic matter would decay under the sediment and water in anoxic conditions, rendering their oils and producing natural gas. We’re going to be talking about global warming and the carbon cycle next week so I was quite enthused when students pointed out the sheen of oils glistening on isolated pools of stagnant water.

The breakdown of buried organic matter produces gas and oils that are less dense than water.

Finally, we returned to the estuary. It’s much larger than the first one we saw, and it’s flat, swampy with lots of distributaries, and chock full of the sediment and debris of the watershed above it.

View of the lake from the estuary. The red iron floc in the stream made for a beautiful contrast with the black of the decaying leaves. There is so much red precipitate that it is visible on the satellite image.

This less than three kilometer hike took the best part of two hours. But that’s pretty fast if you value your dawdling.

Salt and Sugar Under the Microscope

Sugar crystals under 40x magnification.

Salt and sugar crystals have wonderfully distinctive crystal forms. They might well be good subjects for introducing minerals, crystals and some of the more complex geometric solids.

Cube shaped salt crystals under 40x magnification.

The salt crystals are clearly cubic, even though some of the grains seem to be made up of overlapping cubes.

The atoms that make up salt's atomic lattice are arranged in a cubic shape, which results in the shape of the salt crystals. The smaller grey atoms are sodium (Na), and the larger green ones are chlorine (Cl).

Salt is an ionic compound, made of sodium and chloride atoms (NaCl). When a number of these molecules get together to form a crystal, they tend to arrange themselves in a cubic pattern. As a result, the salt crystals are also cubic. In fact, if you break a salt crystal, it will tend to break along the planes that are at the surfaces of the planes of the atomic lattice to create a nice, shiny crystal faces. Gem cutters use this fact to great effect when they shape diamonds and other precious stones.

Of course different crystals have different atomic arrangements. The difference is clear when you compare salt to sugar.

A single sugar crystal looks a bit like a fallen column.

Sugar crystals look a bit like hexagonal pillars that have fallen over. According to the Beet-sugar handbook (Asadi, 2007), sugar crystals actually have a monoclinic form, which could end up as asymmetric hexagonal pillars. Salt crystals, on the other hand, have the habit of forming cubes.

Guide to U.S. Geology: For Teachers

The Coastal Plain, one of the three major geologic provinces of the southeastern United States. From the Teacher-Friendly Guide to the Geology of the United States (Picconi, 2003).

J.E. Picconi, from the Paleontogical Research Institution, has a nice website that describes the geology of the different regions of the U.S..

This image shows the low-energy, offshore environment of the grey shales like that of Coon Creek. From Picconi (2003).

The site has a nice clean design, and is readable to anyone with a basic grasp of geology and geologic time.

I’ve looked at the the section on the southeastern U.S., which even a section on the different, official state fossils.

I particularly like the icons they use to show the environments in which the different fossilized organisms once lived.

How Microscopic Shells can tell us the History of the Earth’s Climate

Seeing the bigger picture.

Looking at the smear slides of Coon Creek Sediment Matrix got me thinking about just how important these little, microscopic shells have been for what we know about the Earth’s past climate. In fact, they provide the background knowledge that we have about the changes in climate that we’re seeing today.

Deep sea drilling vessel, JOIDES Resolution. Image via the National Science Foundation.

Back in the 1970’s the Deep Sea Drilling Project collected a lot of sediment cores from all around the world. The deeper you drill under the sea bed the older the sediments are, so micropaleontologists could look at how the organisms that lived in a certain area changed over time. Certain forams that could only live in warm oceans were found living far to the north. By combining all the information from all the sediment cores, they could construct paleo-geographic maps showing what the climate was like in the far past. It’s one of the reasons we know that the Jurassic climate was a lot warmer than today’s climate.

Then they invented mass spectrometers.

Mass specs can find the mass of individual atoms. Calcium carbonate has the chemical formula CaCO3. Water, as we should know by now, is H2O. They both have oxygen atoms, but not all oxygen atoms are equal; some are more equal. Actually, the mass of any atom is made up of the mass of the protons plus the mass of the neutrons in its nucleus. Now, by definition, any atom with eight protons is oxygen; however, while oxygen usually has eight neutrons, it sometimes has nine or even ten.

Your standard oxygen, with eight protons and eight neutrons has an atomic mass of sixteen, and is written as 16O or oxygen-16. Well, oxygen with ten neutrons is going to have a mass of eighteen (8p + 10n) and be called oxygen-18 (18O). These different versions of the same element are called isotopes.

Oxygen-18 has two more neutrons than the much more common oxygen-16. Note that both atoms have eight electrons, but their masses don't count because electrons are really small compared to the protons and neutrons which have about the same mass.
Water molecule with a molecular mass of 20.

What does this have to do with climate? Well a water molecule with two hydrogen atoms, each weighing one atomic mass unit, and one oxygen-16 atom will have a molecular mass of 18, while a water molecule with an oxygen-18 atom will have a mass of 20. When water evaporates from the oceans, the water with the lighter isotope will have an easier time going from liquid to a gas in the atmosphere.

So, during an ice-age for instance, lots of water evaporates from the oceans, falls on land as snow, and then gets trapped in the enormous glaciers that cover entire continents. Since the lighter water molecules evaporate easier from the oceans, they’re the ones that will end up falling as snow and being compressed into glacial ice. The water molecules left behind in the ocean will tend to have the heavier oxygen-18 isotopes. Since the forams use the ocean water as part of the process of creating their calcium carbonate shells, the oxygen from the water ends up in the carbonate (CO3) of the shells. Since the ocean water has extra oxygen-18s during an ice-age, then the shells will have extra oxygen-18 isotopes during an ice-age.

Ridge of ice from the continental glacier in Greenland. Glacial ice will have lighter isotopes than the oceans the water originally evaporated from.Image by Konrad Steffen from the U.S. Antarctic Survey.

Therefore, by measuring the amount of heavy oxygen-18 isotopes that are in a single shell, we can tell how large the glaciers were at the time that shell formed, and tell what the global climate was like.

Of course there are some interesting complexities to the story, but that’s the general idea of how the microscopic shells of long-dead plankton can tell us about the history of the Earth’s climate.