Algebra in Programming, and a First Box

One of the first things you learn in algebra is to use variables to represent numbers. Variables are at the heart of computer programming, and in Python you can use them for more than just numbers. So open the IDLE text editor and get to work.

But first we’ll start with numbers. To assign a number to a variable you just write an equation. Here are a couple (you can copy and paste the code into the IDLE window, but usually typing it in yourself tends to be more meaningful and help you remember):

a = 2
b = 3

Now we can add these two variables together and create a new variable c.

a = 2
b = 3
c = a + b

Which is all very nice, but now we want our program to actually tell us what the result is so we print it to the screen.

a = 2
b = 3
c = a + b
print c

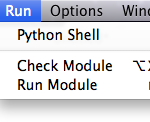
Run this program (F5 or select “Run Module” in the “Run” menu) to get:

Output from the first program: 2+3=5.

Basic Operations and Types of Numbers

Now try some other basic operations:

+ and – are easy as you’ve seen above.

× : for multiplication use *, as in:

a = 2
b = 3
c = a * b
print c

÷ : to divide use a /, as in:

a = 2
b = 3
c = a / b
print c

Now as you know, 2 divided by 3 should give you two thirds, but the running this program outputs 0:

2 divided by 3 to gives 0 because Python thinks we're working with integers.

This is because the Python thinks you’re using integers (a whole number), so it gives you an integer result. If you want a fraction in your result, you need to indicate that you’re using real numbers, or more specifically, rational numbers, which can be integers or fractions, but usually show up as a decimal (these are usually referred to as floating point numbers in programming).

The easiest way to indicate that you don’t just want integers is to make one of your original numbers a decimal:

a = 2.0
b = 3
c = a / b
print c

which produces:

Use a = 2.0 to indicate that we're using rational numbers.

Other Things Can Be Variables

In object oriented programming languages like Python you can assign all sorts of things to variables, not just numbers.

To create a box and give it a variable name you can use the program:

from visual import *
c = box()

which produces:
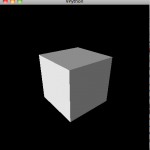
A box created with VPython. It looks much more interesting if you rotate it to see it in perspective.

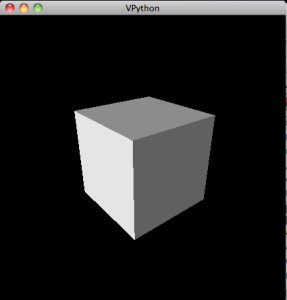
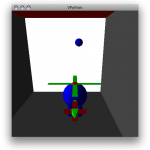
A rotated, zoomed-out view of a box.

To rotate the view, hold down and drag the right mouse button. To zoom in or out, hold down the right and left buttons together and drag in and out. Mac users will probably have to use the “option” button to zoom, and the “command” button to rotate.

The line from visual import * tells the computer that it needs to use all the stuff in the module called “visual”, which has all the commands to make 3d objects (the “*” indicates all).

The c = box() line creates the box and assigns it a variable name of c. You don’t just have to use letters as variable names. In programming you want to use variable names that will remind you of what it’s supposed to represent. So you could just as well have named your variable “mybox” and gotten the same result:

from visual import *
mybox = box()

Now objects like this box have properties, like color. To make the box red you set the color property in one of two ways. The first method is to set the color as you create the object:

from visual import *
mybox = box(color = color.red)

The second is to set the property using the variable you’ve created and “dot” (.) notation.

from visual import *
mybox = box()
mybox.color = color.red

In both of these color.red is a variable name that the computer already knows because it was imported when you imported the “visual” module. There are a few other named colors like color.green and color.blue that you can find out more about in the VPython documentation (specifically here).

You can also find out about the other properties boxes have, like length, width and position (pos), as well as all the other objects you can create, such as springs, arrows and spheres.

At this point, its probably worth spending a little time creating new objects, and varying their properties.

Overview

We’ve just covered:

  • Assigning values to variables
  • Basic operations (+,-,×, and ÷)
  • Types of Numbers: Integers versus floating point
  • Assigning 3d objects to variables
  • Setting properties of 3d objects

Next we’ll try to make things move.

References

For how to install and run VPython, check here.
Algebra and Programming with VPython

Computer programming is the place where algebra comes to life. Students seem to get really excited when they write even the simplest instructions and see the output on the screen. I’m not sure exactly why this is the case, but I suspect it has something to do with being able to see the transition from abstract programming instructions to “concrete” results.

So I’ve decided to supplement my Algebra classes with an introduction to programming. I’m using the Python programming language, or, more specifically, the VPython variant of the language.

Why VPython? Because it’s free, it’s an easy-to-use high-level language, and it’s designed for 3d output, which seems to be somewhat popular these days. The oohs and aahs of seeing the computer print the result of a+b turn into wows when they create their first box. I’ve used the language quite a bit myself, and there are a lot of other interesting applications available if you search the web.

VPython was created to help with undergraduate physics classes, but since it was made to be usable by non-science majors, it’s really easy for middle and high school students to pick up. In fact, NCSU also has a distance education course for high school physics teachers. They also have some instructional videos available on YouTube that provide a basic introduction.

Image from a game created by middle school student Ryan W.

I use VPython models for demonstrations in my science classes, I’ve had middle school students use it for science projects, and I’ve just started my middle school algebra/pre-algebra students learning it as a programming language and they’re doing very well so far.

What I hope to document here is the series of lessons I’m putting together to tie, primarily, into my middle school algebra class, but should be useful as a general introduction to programming using VPython.

Getting VPython

You’ll need to install Python and VPython on your system. They can be directly downloaded from the VPython website’s download page for Windows, Macintosh or LINUX.

Running a Python program.

Once they’re installed, you’ll have the IDLE (or VIDLE) program somewhere on your system; a short-cut is usually put on the desktop of your Windows system. Run (double-click) this program and the VPython programming editor will pop up any you’re ready to go. You can test it by typing in something simple like:

a = 1
b = 2
c = a + b
print c

Then you run the program by going through the Run–>Run Module in the menu bar.

Which should cause a new window to pop up with:

Python 2.7.1 (r271:86882M, Nov 30 2010, 09:39:13) 
[GCC 4.0.1 (Apple Inc. build 5494)] on darwin
Type "copyright", "credits" or "license()" for more information.
>>> ================================ RESTART ================================
>>> 
3
>>> 

Even better might be to test the 3d rendering, which you can do with the following program:

from visual import *

box()

which creates the following exciting image:

A box created with VPython. It looks much more interesting if you rotate it to see it in perspective.

To rotate the view, hold down and drag the right mouse button. To zoom in or out, hold down the right and left buttons together and drag in and out.

A rotated, zoomed-out view of a box.

Lessons

Lesson 1: Variables, Basic Operations, Real and Integer Numbers and the First Box.

Lesson 2: Creating a graphical calculator: Coordinates, lists, loops and arrays: A Study in Linear Equations

Build Your Own Solar System: An Interactive Model

National Geographic has a cute little game that lets you create a two-dimensional solar system, with a sun and some planets, and then simulates the gravitational forces that make them orbit and collide with each other. The pictures are pretty, but I prefer the VPython model of the solar system forming from the nebula.

The models starts off with a cloud of interstellar bodies which are drawn together by gravitational attraction. Every time they collide they merge creating bigger and bigger bodies: the largest of which becomes the sun near the center of the simulation, while the smaller bodies orbit like the planets.

This model also comes out of Sherwood and Chabay’s Physics text, but I’ve adapted it to make it a little more interactives. You can tag along for a ride with one of the orbiting planets, which, since this is 3d, makes for an excellent perspective (see the video). You can also switch the trails on and off so you can see the paths of the planetary bodies, note their orbits and see the deviations from their ideal ellipses that result from the gravitational pull of the other planets.

I’ve found this model to be a great way to introduce topics like the formation of the solar system, gravity, and even climate history (the ice ages over the last 2 million years were largely impelled by changes in the ellipticity of the Earth’s orbit).

National Geographic’s Solar System Builder is here.

Interactive Model showing the Kinetic Energy of a Gas

I really like this little video because it’s relatively dense with information but its visual cues complement each other quite nicely; the interactive model it comes from is great for demonstrations, but even better for inquiry-based learning. The model and video both show the motion of gas molecules in a confined box.

In the video, the gas starts off at a constant temperature. Temperature is a measure of how fast the particles are moving, but you can see the molecules bouncing around at different rates because the temperature depends on the average velocity (via Kinetic Energy), not the individual rates of motion. And if you look carefully, you notice the color of the particles depends on how fast they’re moving. A few seconds into the video, the gas begins to cool, and you can see the particles slow down and gradually the average color changes from blue (fast) to red and then some even fade out entirely.

In the interactive, VPython model I’ve put in a slider bar so you can control the temperature and observe the changes yourself. The model is nicely set up for introducing students to a few physics concepts and to the scientific method itself via inquiry-based learning: you can sit them down in front of the program, tell them it’s gas molecules in a box, have them observe carefully, record what they see, and then explain their observations. From there you can branch off into a lot of different places depending on the students’ interests.

Temperature (T) – a measure of the average kinetic energy (KEaverage) of the substance. In fact, it’s proportional to the kinetic energy, giving a nice linear equation in case you want to tie it into algebra:
! T = c {KE}_{average}
where c is a constant.

Of course, you have to know what kinetic energy is to use this equation.
! KE = \frac{1}{2} m v^2
Which is a simple parabolic curve with m being the mass and v the velocity of the object.

The color changes in the model are a bit more metaphoric, but they come from Wein’s Displacement Law, which relates the temperature of an object, like a star, to the color of light it emits (different colors of light are just different wavelengths of light).

! T = \frac{b}{l}

where b is another constant and l is the wavelength of light. This is one of the ways astronomers can figure out the temperature of different types of stars.

Notes

The original VPython model, from Chabay and Sherwood’s (2002) physics text, Matter and Interactions, comes as a demo when you install their 3D modeling program VPython.

I’ve posted about this model before, but I though it was worth another try now that I have the video up on YouTube.

The Middle School Bank and Trust: A Personal Finance Simulation

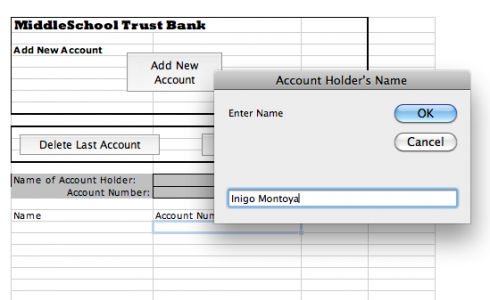
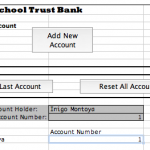
Excel program for running the Middle School Bank in the personal finance simulation. As you can see, I'm creating an account for my student, Inigo Montoya.

To get students a little more familiar with personal finance, we’re doing a little bank account simulation, and I created a little Excel program to make things a little easier.

It’s really created for the class where students can come up to the bank individually, and the banker/teacher can enter their name and print out their checks as they open their account.

Excel program for running the Middle School Bank in the personal finance simulation.

The front sheet of the spreadsheet (called the “Bank Account” sheet) has three buttons. The first, the “Add New Account” button, asks you to enter the student’s name and it assigns the student an account number, which is used on all the checks and deposit slips. The other two buttons let you delete the last account you entered, and reset the entire spreadsheet, respectively.

One of Inigo's checks (number 4).

Once you’ve created an account the spreadsheet updates the “Checks and Deposit Slips” sheet with the student’s name and account number. If you flip to that sheet you can print out eight checks and five deposit slips, which should be enough to get you through the simulation. The checks are numbered and have the student’s account number on them.

There are two other sheets. One is the “Checkbook Register”, which is generic and each student should get one, and the other is called “Customer Balances”. The latter is set up so you (the teacher) can enter all the deposits and withdrawals the students make, and keep track of it all on the same page.

Yes, it’s a bit of overkill, but I though that, since I was going through the effort, I should probably do a reasonable job. Besides, it gave me a chance to do a little Visual Basic programming to keep my hand in. While I teach programming using VPython (see this for example, but I’ll have to do a post about that sometime) you can do some very interesting things in Excel.

Note: I’ve updated the Excel file.

POV-Ray: 3d rendering

Giles Tran’s amazing rendering of glasses on the counter inspired me to check through my own POV-Ray generated library. Nothing nearly as good, but some of it is still might be useful.

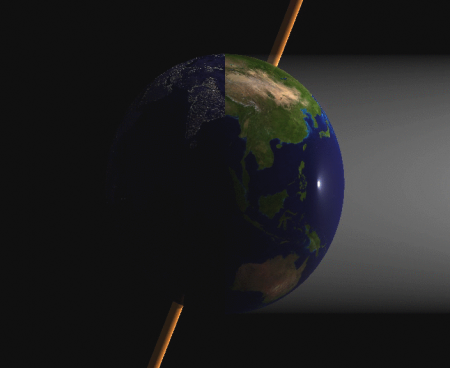
Demonstrating the axial tilt of the Earth, this image shows the Earth at the northern hemisphere's summer solstice.
Rotating Earth at the northern hemisphere's winter solstice.

You build 3d models in POV-Ray and then export 2d images from whichever point of view you want, so once you have the model set up you can easily change the perspective or even move objects to create animations.

POV-Ray does not have any useful sort of user interface; you’re usually creating your models with computer code. It can therefore be challenging to use, and, as with any 3d programming language, a bit of geometry, trigonometry and algebra are needed.

However, the final results can be impressive. I’m continually amazed each year by the quality of the work added to their Hall of Fame.

For much easier, quicker and not so sophisticated 3d results, I use VPython, which is also a great way to learn programming that outputs 3d images.

Seeing temperature, kinetic energy and color

We read that temperature is the average kinetic energy of a substance but you can (especially if you’re a visual learner) nicely internalize this from simple videos or animations. UCAR has a little animation with their definition of temperature. I however, adapted an interactive, 3d animation that I think does a nice job, and also introduces a couple of other interesting concepts too.

I’ve also used this model, at different times, to show:

  • The relationship between temperature and color emitted by objects. The main way we know the temperature of stars is because blue stars are hotter than red stars. Blue light has a shorter wavelength than red light, and things that are at higher temperatures emit shorter wavelengths.
  • Absolute zero (0 Kelvin) – where (almost) all motion stops and the objects stop emitting light.
  • Pressure in a gas – you really get a feel for the force exerted by the particles on the side of the box (although it might be even more interesting once I figure out how to add sound).

It is an interactive model, but it’s pretty simple because the only control is a slider that lets you set the temperature.

Finally, in the age of 3d movies, like Avatar, the models can be easily shown in 3d if you have the glasses (redcyan).

The model is easy to install and run on Windows, but you have to install the programming language VPython separately on a Mac (but that isn’t very hard). I have this, and a bunch of other models, at http://earthsciweb.org/GeoMod/.