Yesterday we used calculus to find the equation for the height of water in a large plastic water bottle as the water drained out of a small hole in the bottom.
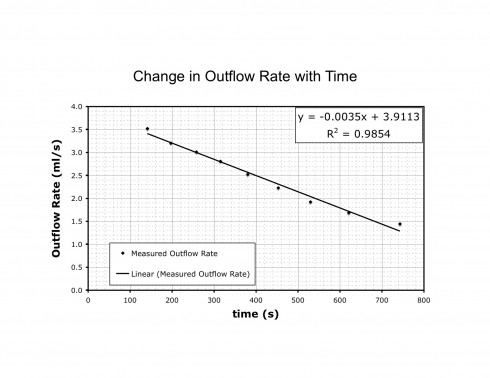
Perhaps the most crucial point in the procedure was fitting a curve to the measured reduction of the water’s outflow rate over time. Yesterday, in our initial attempt, we used a straight line for the curve, which produced a very good fit.

The R2 value is a measure of how good a fit the data is to the trendline. The straight line gives an R2 value of 0.9854, which is very close to a perfect fit of 1.0 (the lowest R2 can go is 0.0).
The resulting equation, written in terms of the outflow rate (dV/dt) and time (t), was:
![]()
However, if you look carefully at the graph in Figure 1, the last few data points suggest that the outflow does not just linearly decrease to zero, but approaches zero asymptotically. As a result, a different type of curve might be a better trendline.
Types of Equations
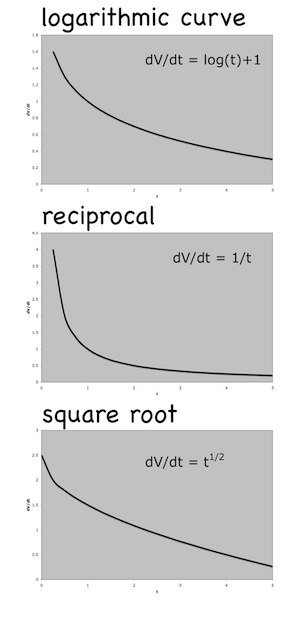
So my calculus students and I, with a little help from the pre-Calculus class, tried to figure out what types of curves might work. There are quite a few, but we settled for looking at three: a logarithmic function, a reciprocal function, and a square root function. These are shown in Figure 2.

I steered them toward the square root function because then we’d end up with something akin to Torricelli’s Law (which can be derived from the physics). A basic square root function for outflow would look something like this:
![]()
the a coefficient stretches the equation out, while the b coefficient moves the curve up and down.
Fitting the Curve
Having decided on a square-root type function, the next problem was trying to find the actual equation. Previously, we used Excel to find the best fit straight line. However, while Excel can fit log, exponential and power curves, there’s no option for fitting a square-root function to a graph.
To get around this we linearized the square-root function. The equation, after all, looks a lot like the equation of a straight line already, the only difference is the square root of t, so let’s substitute in:
![]()
to get:
![]()
Now we can get Excel to fit a straight line to our data, but we have to plot the square-root of time versus temperature instead of the just time versus temperature. So we take the square root of all of our time measurements:
| Time | Square root of time | Outflow rate |
|---|---|---|
| t (s) | t1/2 = x (s1/2) | dV/dt (ml/s) |
| 0.0 | 0 | 3.91 |
| 45.5 | 6.75 | 3.52 |
| 97.8 | 9.89 | 2.94 |
| 140.9 | 11.87 | 3.52 |
| 197 | 14.04 | 3.21 |
| 257 | 16.05 | 3.01 |
| 315.1 | 17.75 | 2.81 |
| 380.1 | 19.50 | 2.53 |
| 452.9 | 21.28 | 2.23 |
| 529.6 | 23.01 | 1.92 |
| 620.7 | 24.91 | 1.69 |
| 742.7 | 27.25 | 1.45 |
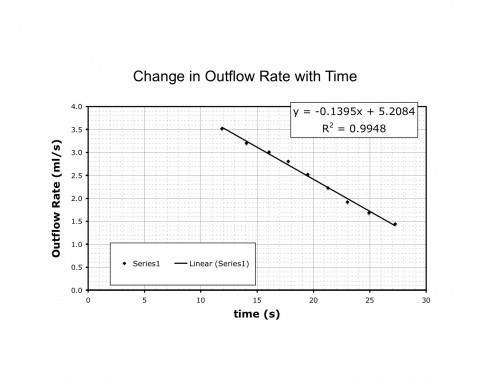
We can now plot the outflow rate versus the square root of time (Figure 3).

The equation Excel gives (Figure 3), is:
![]()
and we can substitute back in for x=t1/2 to get:
![]()
Getting back to the Equation for Height
Now we can do the same procedure we did before to find the equation for height.
First we substitute in V=πr2h:
![]()
Factor out the πr2 and move it to the other side of the equation to solve for the rate of change of height:
![]()
Then integrate to find h(t) (remember![]() ) :
) :
![]()
gives:
![]()
which might look a bit ugly, but that’s only because I haven’t simplified the fractions. Since the radius (r) is 7.5 cm:
![]()
Finally we substitute in the initial value (t=0, h=11) to solve for the coefficient:
![]()
giving the equation:
![]()
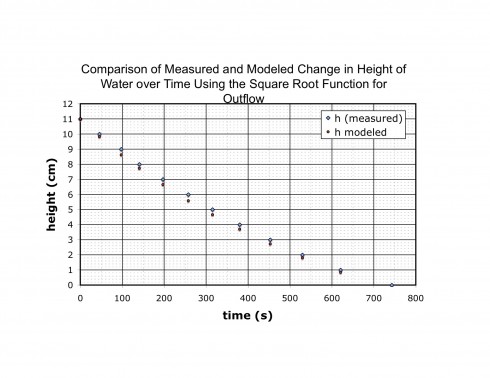
Plotting the equations shows that it matches the measured data fairly well, although not quite as well as when we used the previous linear function for outflow.

Discussion
I’m not sure why the square root function for outflow does not give as good a match of the measurements of height as does the linear function, especially since the former better matches the data (it has a better R2 value).
It could be because of the error in the measurements; the gradations on the water bottle were drawn by hand with a sharpie so the error in the height measurements there alone was probably on the order of 2-3 mm. The measurement of the outflow volume in the beaker was also probably off by about 5%.
I suspect, however, that the relatively short time for the experiment (about 15 minutes) may have a large role in determining which model fit better. If we’d run the experiment for longer, so students could measure the long tail as the water height in the bottle got close to the outlet level and the outflow rate really slowed down, then we’d have found a much better match using the square-root function. The linear match of the outflow data produces a quadratic equation when you integrate it. Quadratic equations will drop to a minimum and then rise again, unlike the square-root function which will just continue to sink.
Conclusions
The linearization of the square-root function worked very nicely. It was a great mathematical example even if it did not produce the better result, it was still close enough to be worth it.