Klaus Lackner from Columbia University describes one type of artificial carbon sequestration technology, and explains why it’s necessary.
Year: 2013
Atom Builder
This app lets you drag and drop electrons, protons, and neutrons to create atoms with different charges, elements, and atomic masses. You can also enter the element symbol, charge and atomic mass and it will build the atom for you.
Note, however, it only does the first 20 elements.
Wiggle Matching: Sorting out the Global Warming Curve
To figure out if the climate is actually warming we need to extract from the global temperature curve all the wiggles caused by other things, like volcanic eruptions and El Nino/La Nina events. The resulting trend is quite striking.
I’m teaching pre-Calculus using a graphical approach, and my students’ latest project is to model the trends in the rising carbon dioxide record in a similar way. They’re matching curves (exponential, parabolic, sinusoidal) to the data and subtracting them till they get down to the background noise.

The Smog in Beijing
We talked today about the smog in Beijing.

[A]t the time of the image, the air quality index (AQI) in Beijing was 341. An AQI above 300 is considered hazardous to all humans, not just those with heart or lung ailments. AQI below 50 is considered good. On January 12, the peak of the current air crisis, AQI was 775 the U.S Embassy Beijing Air Quality Monitor—off the U.S. Environmental Protection Agency scale—and PM2.5 was 886 micrograms per cubic meter.
–Carlowicz (2013): via NASA Earth Observatory
The pollution in Beijing seems to be a result of automobiles and construction, and not factories as you might think. One of my Chinese students (A.S.) pointed out that the Chinese government had moved a whole lot of factories out of Beijing about 10 years ago in preparation for the Olympics. Curiously, the factories were relocated to poorer areas as the cities have become wealthier; something we’ve seen at a global scale as well.
The relocation of factories out of Beijing is part of a mass migration of Chinese industry in recent years from wealthier cities, which have become environmentally conscious, to less-developed ones.
–Cha (2008): Relocation of Beijing factories only moved the problem in the Washington Post via the Seattle Times.
Photosynthetic Salamanders?

The salamanders themselves don’t do photosynthesis, but they host symbiotic algae that do.
Spotted salamanders, too, are in a long-term relationship with photosynthetic algae. In 1888, biologist Henry Orr reported that their eggs often contain single-celled green algae called Oophila amblystomatis. The salamanders lay the eggs in pools of water, and the algae colonise them within hours.
By the 1940s, biologists strongly suspected it was a symbiotic relationship, beneficial to both the salamander embryos and the algae. The embryos release waste material, which the algae feed on. In turn the algae photosynthesise and release oxygen, which the embryos take in. Embryos that have more algae are more likely to survive and develop faster than embryos with few or none.
Then in 2011 the story gained an additional twist. A close examination of the eggs revealed that some of the algae were living within the embryos themselves, and in some cases were actually inside embryonic cells. That suggested the embryos weren’t just taking oxygen from the algae: they might be taking glucose too. In other words, the algae were acting as internal power stations, generating fuel for the salamanders.
–Marshall (2013): Zoologger: The first solar-powered vertebrate in New Scientist based on Graham et al. (2012).
If the World were a Village of 100
A student (N.C.) sent me this neat video based on the If the World Were a Village website. I plan to show it to my environmental science class because we’ve been talking about human population recently.
Patterns in the Periodic Table

Why is the periodic table called the periodic table? Because of the periodic changes in the properties of the elements: there are patterns to the properties that repeat, time after time, as you go through the sequence of the elements. One key repetition, which affects the way different elements react, is in the electron configurations, however, other properties change as well. In fact, history of the periodic table
is a story of scientists trying to figure out the properties of unknown elements (not to mention figuring out that there were undiscovered elements) based on what they knew about the periodicity of the known elements.
File: periodic-table-properties.xls
In this exercise, we look at four different properties that students need to be aware of: density, melting point, ionization energy, and electronegativity. I’ve compiled the data in this spreadsheet: periodic-table-properties.xls; and I handed out the first page, with the properties of the first 38 elements (periodic-table-properties.xls.pdf).

I broke the class into pairs and had each pair graph one of the four sets of data. With 16 students that meant that we had a replicate of each graph, so I could use the redundancy as a quick check that they’d done them correctly.

As they put drew their graphs I went around the classroom, paying special attention to the students working on ionization energy and electronegativity. Especially for the latter, I’d picked pairs who I figured would be able to get the graphs done quickly but would appreciate the extra challenge of figuring out what electronegativity actually is. This way, when everyone was done, the students could use their graphs to look for the patterns and explain what they’d found to the rest of the class.

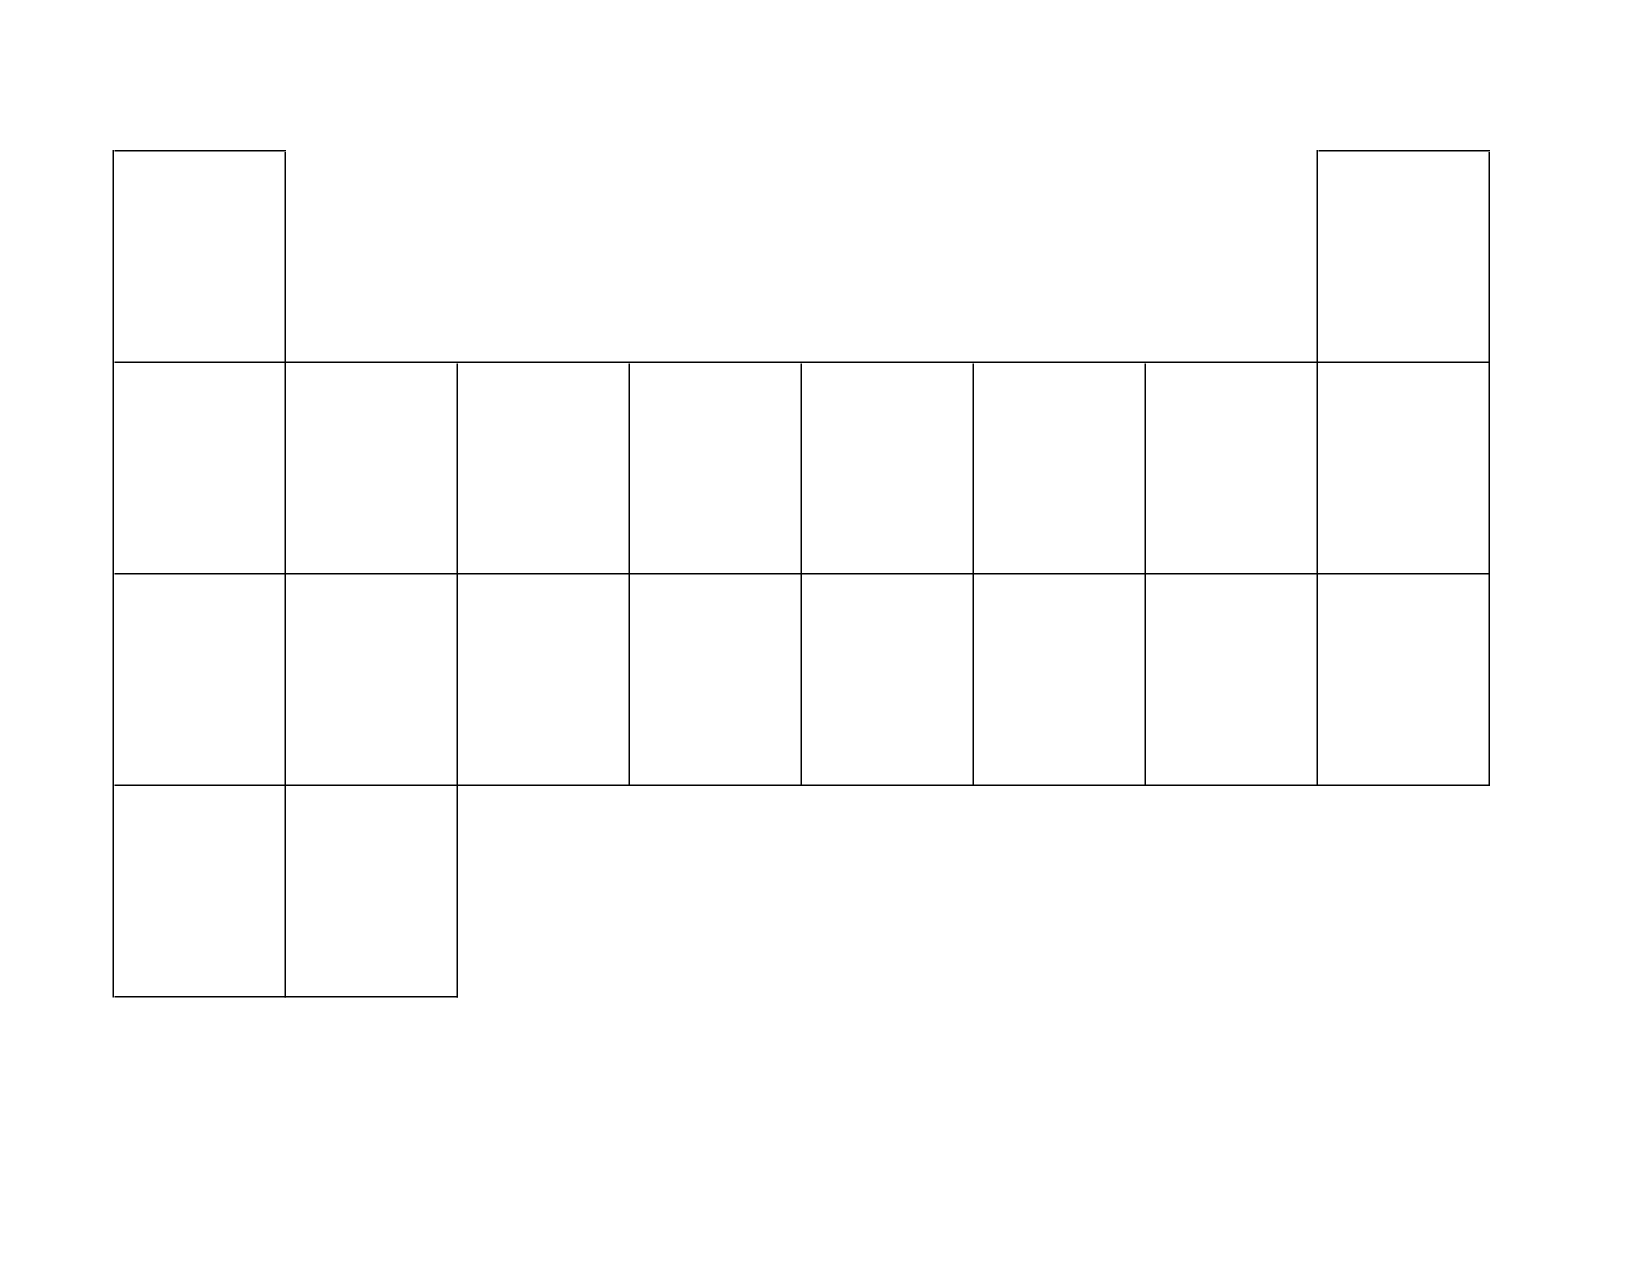
Electron Configurations on the Periodic Table
Having demonstrated how to draw a few simple atoms, I had students fill out a periodic table template with drawings of the first twenty atoms. Actually, I only had them draw the electrons in their shells because it reduced the messiness of trying to fit in forty nuclear particles into a small tile, and the point I wanted to get at was the pattern of shells and valence electrons in the periodic table.
The end result looked something like this:

All the drawing only took about 15 minutes, and once they’d figured out the first half dozen or so it started to get a little boring. But that freed up the cognitive resources so they could notice the two key patterns.
- First, each row in the periodic table has an additional electron shell.
- Second, as you go across a row you add one electron to the shell until it is filled.
It’s a first glimpse at the periodicity in the periodic table. And it sets us up nicely to be able to talk about chemical bonding.