One of my students is taking an advanced statistics course–mostly online–and it introduced her to the statistical package R. I’ve been meaning to learn how to use R for a while, so I had her show me how use it. This allowed me to give her a final exam that used some PEW survey data for analysis. (I used the data for the 2013 LGBT survey). These are my notes on getting the PEW data, which is in SPSS format, into R.
Instructions on Getting PEW data into R
Go to the link for the 2013 LGBT survey“>2013 LGBT survey and download the data (you will have to set up an account if you have not used their website before).
- There should be two files.
- The .sav file contains the data (in SPSS format)
- The .docx file contains the metadata (what is metadata?).
- Load the data into R.
- To load this data type you will need to let R know that you are importing a foreign data type, so execute the command:
> library(foreign)
> file.choose()
> dataset = read.spss(“C:\\Users\...”)
> summary(dataset)
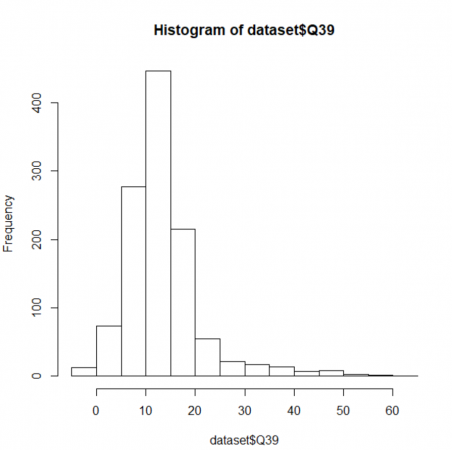
> hist(dataset$Q35)
> write.csv(dataset$Q39, ”helloQ39Data.csv”)
This should be enough to get started with R. One problem we encountered was that the R version on Windows was able to produce the histogram of the dataset, while the Mac version was not. I have not had time to look into why, but my guess is that the Windows version is able to screen out the non-numeric values in the dataset while the Mac version is not. But that’s just a guess.
