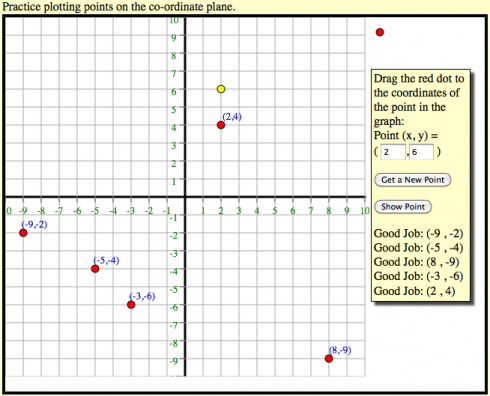
Pre-Algebra class starts next week, so in preparation for one of the early lessons on how to plot x,y co-ordinates, I put together an interactive plotter that lets students drag points onto the co-ordinate plain.

Usage
The program generates random coordinate pairs within the area of the chart (or you can enter values of the coordinates yourself):
- Clicking the “Show Point” button will place a yellow dot at the point.
- When you’re confident you understand how the coordinate pairs work, you can practice by dragging the red dot to where you think the point is and the program will tell you if you’re right or not.
About the Program
This interactive application uses the jQuery and KineticJS javascript libraries. The latter library in particular is useful for making the HTML5 canvases interactive, so you can click on points on the graph and drag them.
When I have some time, after classes settle down, I’ll see if I can figure out how to embed this type of app into this (WordPress) blog. KineticJS is based off HTML5 canvases, which is what I use for the other interactive graphs I’ve posted, so it shouldn’t be terribly hard (at least in principle).