
The vPlants Project. vPlants: A Virtual Herbarium of the Chicago Region. http://www.vplants.org is a wonderfully comprehesive collection of pictures with plant descriptions: plant form; leaf shapes; stem and leaf patterns; flower shapes; and more.
Middle and High School … from a Montessori Point of View
The vPlants Project. vPlants: A Virtual Herbarium of the Chicago Region. http://www.vplants.org is a wonderfully comprehesive collection of pictures with plant descriptions: plant form; leaf shapes; stem and leaf patterns; flower shapes; and more.
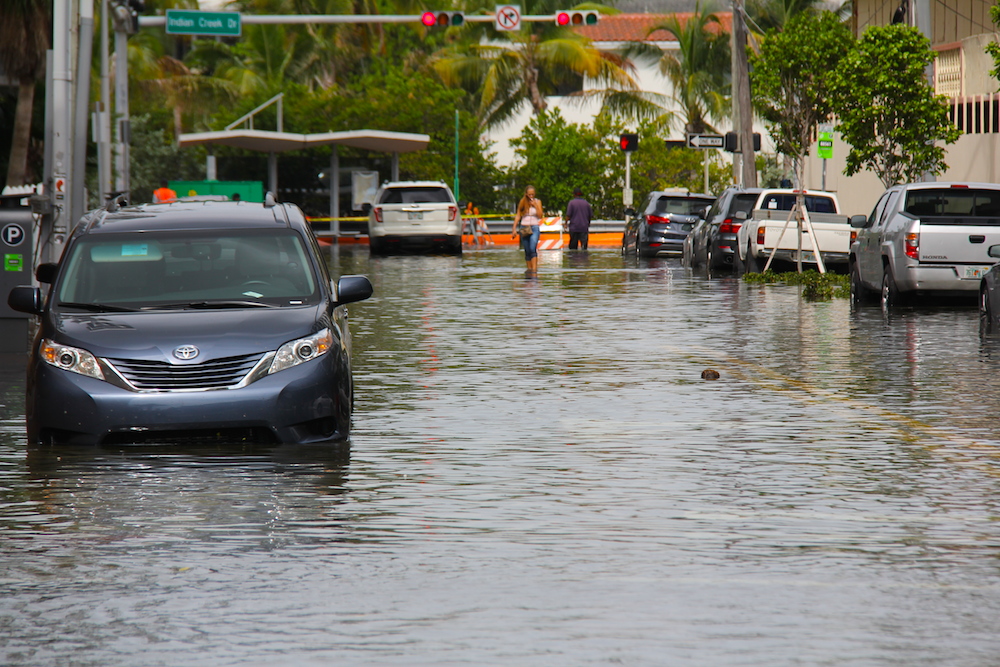
The Siege of Miami: A detailed report that looks at the increasing frequency of flooding in Miami, because of sea-level-rise. The reporter interviews a number of scientists and engineers who are not terribly optimistic about the long-term (50+ years) future of many Floridian cities because of the melting ice-caps in Greenland and Antarctica.
Physicists in Europe Find Tantalizing Hints of a Mysterious New Particle: This new particle, if confirmed to exist (the data is not conclusive) seems to go beyond the Standard Model of physics that we know and love.
The last sub-atomic particle discovered was the Higgs boson, which is shown in the graph below.
A quick program that animates scaling (dilation) of shapes by scaling the coordinates. You type in the dilation factor.
dilation.py
from visual import * #axes xmin = -10. xmax = 10. ymin = -10. ymax = 10. xaxis = curve(pos=[(xmin,0),(xmax,0)]) yaxis = curve(pos=[(0,ymin),(0,ymax)]) #tick marks tic_dx = 1.0 tic_h = .5 for i in arange(xmin,xmax+tic_dx,tic_dx): tic = curve(pos=[(i,-0.5*tic_h),(i,0.5*tic_h)]) for i in arange(ymin,ymax+tic_dx,tic_dx): tic = curve(pos=[(-0.5*tic_h,i),(0.5*tic_h,i)]) #stop scene from zooming out too far when the curve is drawn scene.autoscale = False # define curve here shape = curve(pos=[(-1,2), (5,3), (4,-1), (-1,-1)]) shape.append(pos=shape.pos[0]) shape.color = color.yellow shape.radius = 0.1 shape.visible = True #dilated shape dshape = curve(color=color.green, radius=shape.radius*0.9) for i in shape.pos: dshape.append(pos=i) #label note = label(pos=(5,-8),text="Dilation: 1.0", box=False) intext = label(pos=(5,-9),text="> x", box=False) #scaling lines l_scaling = False slines = [] for i in range(len(shape.pos)): slines.append(curve(radius=shape.radius*.5,color=color.red, pos=[shape.pos[i],shape.pos[i],shape.pos[i]])) #animation parameters animation_time = 1. #seconds animation_smootheness = 30 animation_rate = animation_smootheness / animation_time x = "" while 1: #x = raw_input("Enter Dilation: ") if scene.kb.keys: # event waiting to be processed? s = scene.kb.getkey() # get keyboard info #print s if s <> '\n': x += s intext.text = "> x "+x else: try: xfloat = float(x) note.text = "Dilation: " + x endpoints = [] dp = [] for i in shape.pos: endpoints.append(float(x) * i) dp.append((endpoints[-1]-i)/animation_smootheness) #print "endpoints: ", endpoints #print "dp: ", dp for i in range(animation_smootheness): for j in range(len(dshape.pos)): dshape.pos[j] = i*dp[j]+shape.pos[j] rate(animation_smootheness) if slines: for i in range(len(shape.pos)): slines[i].pos[1] = vector(0,0) slines[i].pos[-1] = dshape.pos[i] for i in range(len(shape.pos)): dshape.pos[i] = endpoints[i] slines[i].pos[-1] = dshape.pos[i] for i in range(len(shape.pos)-1): print shape.pos[i], "--->", dshape.pos[i] except: #print "FAIL" failed = True intext.text = "> x " x = ""
For the student who asked how do we know about black holes if we can’t see them. From NASA. Based on the paper: http://www.nasa.gov/mission_pages/chandra/destroyed-star-rains-onto-black-hole-winds-blow-it-back.html
This quick program is intended to introduce differentiation as a way of finding the slope of a line. Students know how to find the slope of a tangent line at least conceptually (by drawing). We pick a curve: in this case:
then enter values of x in the program to see how x, the function value and the differential compare to each other.
x | f(x) | f'(x) |
---|---|---|
0.5 | 0.25 | 1 |
1 | 1 | 2 |
2 | 2 | 4 |
3 | 9 | 6 |
Because it’s quick you have to change the function in the code, and enter the values for x in the python shell.
differentiation_intro_numeric.py
from visual import * class tangent_line: def __init__(self): self.dx = 0.1 self.line = curve() self.tangent_line = curve() self.point = sphere(radius=.25,color=color.yellow) self.point.visible = False self.label = label(pos=(-5,-8)) '''CHANGE FUNCTION (y) HERE''' # the original function def f(self, x): #y = sin(x) y = x**2 return y '''END CHANGE FUNCTION HERE''' def find_slope(self, x): sdx = .00001 m = (self.f(x+sdx)-self.f(x))/sdx return round(m,3) def draw(self): for x in arange(xmin, xmax+self.dx, self.dx): self.line.append(pos=(x, self.f(x))) def draw_tangent(self, x): m = self.find_slope(x) y = self.f(x) b = y - m * x print "When x = ", x, " slope = ", m self.label.text = "point: (%1.2f, %1.2f)\nSlope: %1.2f" % (x,y,m) self.plot_point(x) #draw tangent self.tangent_line.visible = False self.tangent_line = curve(pos=[(xmin,m*xmin+b),(xmax,m*xmax+b)], color=color.yellow) def plot_point(self, x): self.point.visible = True self.point.pos = (x, self.f(x)) #axes xmin = -10. xmax = 10. ymin = -10. ymax = 10. xaxis = curve(pos=[(xmin,0),(xmax,0)]) yaxis = curve(pos=[(0,ymin),(0,ymax)]) #tick marks tic_dx = 1.0 tic_h = .5 for i in arange(xmin,xmax+tic_dx,tic_dx): tic = curve(pos=[(i,-0.5*tic_h),(i,0.5*tic_h)]) for i in arange(ymin,ymax+tic_dx,tic_dx): tic = curve(pos=[(-0.5*tic_h,i),(0.5*tic_h,i)]) #stop scene from zooming out too far when the curve is drawn scene.autoscale = False # draw curve func = tangent_line() func.draw() # get input while 1: xin = raw_input("Enter x value: ") func.draw_tangent(float(xin))
Initial reports indicated a chicken with a broken leg; some rumors suggested the chicken had gone missing as well. These reports instigated an investigation by the Chicken Committee. They determined that the chicken was there, but something was wrong. They sent out a call for medical assistance.
Help came in the form of Dr. Emily Leonard from the Cherry Hills Veterinary Hospital (who happens to be a mom at our school). She took the chicken in for examination.
Based on the X-ray, there were no bones broken, so the issue must have been something else. The large egg that showed up on the radiograph suggested that the chicken could have been egg-bound, however, 20 minutes later, the chicken laid the egg.
So, the chicken is still under observation.
After the initial examination, Dr. Leonard brought the chicken back to school. It needed to be isolated and observed–which is something we now know to do in the future in any other case of injury–and the head of the Chicken Committee (the Chicken Head) made the call that the animal should go back to the hospital for the weekend.
Dr. Leonard deals mostly with pets, so she had to do quite a bit of research. “I learned a lot about chickens today,” she told me afterwards. This is a message I hope the students internalize. With the ready access to information we have today, it’s not so much about the facts you have memorized, but more about having the flexibility and ability to deal with new challenges by doing research and then applying what you learn are essential skills.