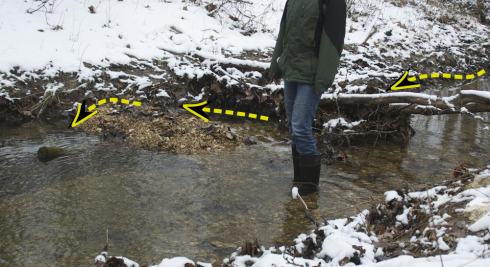
Life Under the Ice

Algae growing under the ice on the creek.

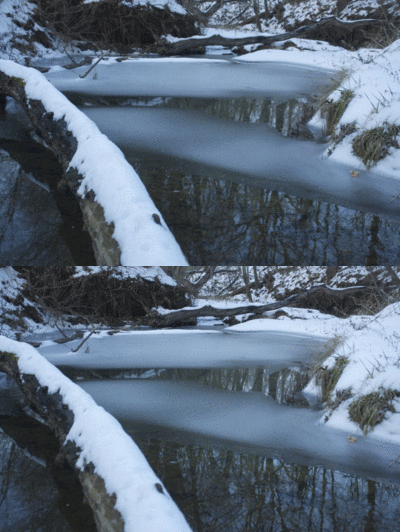
While not quite as dramatic as drilling through four kilometers of ice to find signs of live in an Antarctic lake that’s been isolated from the rest of the world for over 100,000 years, we observed filamentous algae blooming under the clear ice on the creek earlier this winter.

Algae under the microscope (40x magnification).

I collected some of the algae and put it into the fish tank; I was hoping I could use it when we looked at plant cells because aquatic plants tend to have larger cells that are easier to see under the microscope.

However, one of my students is keeping tadpoles (also from the creek) in the fish tank. She noticed that the tadpoles were hanging out on top of the algae, and the algae was disappearing. Well, at least we’d solved her problem about what to feed the tadpoles.

Unknown microbe hanging out in the algae.

While the filamentous algae might not be as good as the Egeria densa for plant-cell microscopy, it does host quite a number of other microbes that are fascinating to look at.

Ecological Role of Algae

Based on these observations, ecologically the filamentous algae does not just provide habitat for protists and other microbes, it also appears to be a significant source of food for larger animals, like the tadpoles, and probably also the small fish that live in the creek.

Bubbles trapped under the ice. With all the algae growing in the water, and the clear ice, these bubbles may well be made of oxygen.

Therefore, I’d hypothesize that in the winter, when the fish disappear, and most of animal life is quite subdued, the algae blooms because it’s not being grazed on nearly as much (see the picture above). When the weather warms, however, it’s the turn of the algae to repressed.

It would be interesting to have a student monitor the algae growth, and the fish/tadpole population, over the course of the school year to see if the relationship is more than just coincidence.

P.S. After our last snowfall, the melting snow has put a lot of water into the creek, and all the algae appears to have been washed away.

The Creek in Winter at Night

The creek under a waxing moon.

Trivia night let out at midnight. The ground was still covered with a smooth layer of snow. The meltwater from the daytime sun had refrozen to make the snow crisp on top, like a cold crème brûlée. The moon was close to full. I had my camera.

The moon reflected in a pool partially covered by ice.

I spent about twenty minutes traipsing through the woods along the banks of the creek. Not having a tripod made it impossible to get long-exposure without setting the camera down somewhere stable, so I ended up lying prone on the snow. Whilst my jacket and sweater made my top half well insulated, there was just a single layers of broadcloth separating my legs from the snow. I didn’t have a problem with the cold, but my body heat melted the snow, and I got wet.

But it was worth it.

Shaded Relief Maps

Shaded relief of Australia from the Shaded Relief Archive.

The Shaded Relief Archive is a great source of continental scale shaded relief maps. Dr. A. used them when the middle-schoolers built their 3d models of Australia and Antarctica for geography.

Australia: Under Construction.

NASA’s Earth Observatory is another great source.

Australia topography from NASA’s Earth Observatory.

Act Now: The Exponentially Increasing Costs of Not Acting on Climate Change

The Australian Bureau of Meteorology recently had to add two new colors to their temperature maps because the previous colors did not go high enough.

Andrew Sullivan pulls together commentary on a recent research paper that shows that the costs of waiting to act on climate change, far outweigh the costs of acting now. The longer we wait, the more it’s going to cost to prevent the most dangerous effects of climate change. Unfortunately, the costs of waiting will be paid in the future (as will the benefits), so there’s less motivation to act now.

Two degrees is the level that is currently supported by over 190 countries as a limit to avoid dangerous climate change …

“Ultimately, the geophysical laws of the Earth system and its uncertainties dictate what global temperature rise to expect,” said Rogelj. “If we delay for twenty years, the likelihood of limiting temperature rise to two degrees becomes so small that the geophysical uncertainties don’t play a role anymore.”

–Climate Progress (2013): Nature: Limiting Climate Change Will Become Much Harder ‘And More Expensive If Action Is Not Taken Soon’ on ThinkProgress.

On top of this, Fiona Harvey reports on an International Energy Agency report that suggests:

The world is likely to build so many fossil-fuelled power stations, energy-guzzling factories and inefficient buildings in the next five years that it will become impossible to hold global warming to safe levels, and the last chance of combating dangerous climate change will be “lost for ever”, according to the most thorough analysis yet of world energy infrastructure.

— Harvey (2011): World headed for irreversible climate change in five years, IEA warns in The Guardian.

Climate by Proxy

Both [thermometer and proxy] records also show that the global warming in the last 15 years of the record (1980–1995) is significantly faster than that of the long-term trend (1880–1995).

— NOAA (2013): Independent Evidence Confirms Global Warming in Instrument Record.

To figure out what the weather and climate were like in the past, before things like thermometers were invented, scientists use proxies such as: the change in tree ring thickness; differences in the isotopic composition of shells and rocks; records of species change in the oceans; gases in bubbles trapped in glacial ice (as well as the character of the ice itself). Paleoclimatologists at NOAA have analyzed 173 different proxy records to provide a lot more evidence that the increase in temperature we’ve been measuring for the last 150 years (with thermometers) is real.

<a href=”http://www.curatorscode.org” target=”_blank” style=”font-family:sans-serif;text-decoration:none” >&#x21ac;</a> The Dish

Rates of change: 4 cm/liter

The first stage rocket booster separates. Image from NASA via Wikipedia.

Fully loaded, the first stage of the Saturn V rockets that launched the Apollo missions would burn through a liter of fuel for every four centimeters it moved. That’s 5 inches/gallon, which, for comparison, is a lot less than your modern automobile that typically gets over 20 miles/gallon.

Introducing Covalent Bonding

Covalent bonding happens when atoms share electrons, unlike with ionic bonding where one atom gives electrons to another.

Why do some combinations of atoms make ionic bonds and others covalent bonds? The answer has to do with electronegativity, which is the ability of atoms to attract electrons to themselves. Atoms that have similar abilities to attract electrons to themselves will likely form covalent bonds.

Sodium and chloride bond ionically when sodium donates an electron to chlorine.

For either type of bond, the atoms have the same objective. All atoms “want” filled outer electron shells. When sodium reacts with chlorine for example, sodium has one electron in its outer shell and chlorine is one short of a filled outer shell so it’s “easiest” for sodium to just donate its electron to chlorine to make them both happy.

However, when two similar atoms bond it’s often easier to share electrons.

Consider two hydrogens bonding covalently to form hydrogen gas (note: help on drawing atoms).

An hydrogen atom.

Each hydrogen has only one electron, and they both pull equally at the electrons so neither can give their electron away or take the other’s electron. Instead they share.

Two hydrogen atoms bond covalently by sharing electrons.

By sharing, they now each have two electrons in their outer shell, which is now full (since it’s the first shell), and both atoms are happy. This is covalent bonding.

The chemical reaction could be written as:

H + H –> H2

H2O

Now consider what happens when hydrogen atoms bond with oxygens. Oxygen atoms have 6 electrons in their outer shells, but they would like to have 8.

An oxygen atom.

Oxygen atoms aren’t strong enough to take away the hydrogen electrons, so they share with covalent bonds. Each oxygen has to react with two hydrogens to get the two extra electrons it needs to end up with 8 electrons in its outer shell.

Bonding to form a water molecule.

Thus we create water, which has the chemical formula H2O, and the chemical reaction can be written:

2 H + O –> H2O

Drawing covalent molecules

Covalent molecules can be large and complex, in fact, one strand of your DNA will have somewhere around a billion atoms.

To make these easier to draw, you can represent each element by its symbol and each bond by a line. Remember, each covalent bond represents a pair of electrons that are shared.

So our water molecule would be drawn like this:

Drawing a water molecule. The lower drawing is called a Lewis-Dot structure.

This is called a Lewis Dot structure. In addition to the lines showing the bonds, you’ll notice the dots that show the unbonded electrons: these dots are usually paired up.

Double Bonds

The last thing I’ll point out here is that atoms can share more than just one pair of electrons. When they share four electrons that means there are two bonds, which is referred to as a double bond.
Oxygen atoms bond with each other like this to make the oxygen gas we breathe.

Oxygen gas.

Practice

Now you can try drawing these covalent molecules:

  1. A molecule with one nitrogen atom and some hydrogen atoms (can you figure out how many hydrogens)
  2. A molecule with the chemical formula: CH4
  3. A molecule with the chemical formula: C2H6
  4. A molecule with the chemical formula: C3H8
  5. A molecule with the chemical formula: C2H4 (hint there’s a double bond)
  6. A carbon dioxide molecule, which has the chemical formula: CO2
  7. An ozone molecule, which has the chemical formula: O3
  8. An alcohol molecule, which has the chemical formula: CH3OH