History, Captured in the River Fleet Sewer

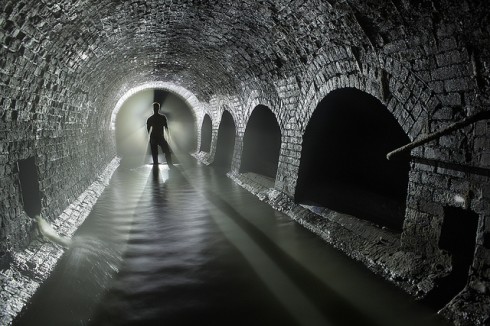
Under London, in the River Fleet. Image by suburban.com via Flickr.

History is hard sometimes, when all you have are dates and events to remember. It helps to have context. Montessori schools build a lot of history and social science on the concept of the needs of people. While the need for electronics excites many of my students, another fundamental need is for sanitation.

RJ Evans has a wonderful post, full of excellent photography that will go a long way toward capturing the imagination, which encapsulates the history of London by looking at the evolution of the River Fleet – from a “clear and sparkling” stream in medieval times, to a chartered, elegant, underground sewer system built by excellent, Victorian engineers that still functions today.

Everything is in place, thanks to the ingenuity of the Victorian engineers, to ensure that the Fleet is confined to these tunnels. Yet it was not always like that. If we travel back a few centuries we find a different story altogether – one which is not without its own pathos if such an emotion can be felt for a river.

– Evans, 2011: The Fleet – London’s Underground River in Kuriositas.

Cyberwar

Perhaps it’s cultural conditioning, or maybe it’s genetic a predisposition, but adolescent boys to seem to have more of a predilection for war games than their female peers. The games they like tend to be first-person-shooters, like Call of Duty, and, given the trends toward improved video game graphics and remote, kinetic military action, real and simulated life seem to be converging.

Recently however, the Stuxnet virus exposed a much less glamorous picture of the future of cyber warfare. Kim Zetter has an excellent, extensive article in Wired on the computer scientists and engineers who reverse engineered the virus to try to figure out who made it and what it did. Since the virus seems to have been aimed at damaging Iran’s nuclear enrichment plants their work brought them to the edge of the world of international espionage. And they still don’t really know who created this remarkably sophisticated virus, though they suspect the U.S. and Israel.

One of the most interesting take-home messages from Zetter’s article is the amazing degree of international collaboration it took to figure things out. The virus was discovered by someone in Belarus. Researchers from the anti-virus company Symantec’s offices in California, Tokyo and Paris worked together passing information from one office to the next to keep the project going 24 hours a day. They published their findings to share them, and when they ran into stumbling blocks they couldn’t solve they put out calls for help on the internet – and people responded, bringing in expertise from Germany and the Netherlands.

The virus’ secretive creators and the open, diverse collaborators who untangled the virus reflect two conflicting aspects of the future that computer technology and the internet are making possible. And this conflict is showing up more and more in different areas – take Wikileaks for example – so it will be very interesting to see where the future takes us. Of course, we are not simply flotsam on the tides of history. As citizens of the internet, we have been enabled. We have a certain power, and a concomitant responsibility, to shape what we have for the benefit of our fellow citizens and those that come after us.

The Future of Stuff

The Story of Stuff is a pretty commonly used video that starts the conversation on resource use and consumerism. The video below, “Full Printed,” takes a look at the future and how technology, particularly 3-D printers, might reduce the environmental costs of the things we use.

FULL PRINTED from nueve ojos on Vimeo.

Update

There are already some places for 3d printing.

My Memory is in the Ether

The experience of losing our Internet connection becomes more and more like losing a friend.

— Sparrow et al., 2011: Google Effects on Memory: Cognitive Consequences of Having Information at Our Fingertips (pdf).

Internet on the brain. Image creating using internet map by Matt Britt (via Wikipedia).

Last year, my students informed me that humans have a fundamental need for electronics. And I was forced to agree. We’re becoming more inseparable from our devices, practically all of which are connected to the internet. So much so, that people aren’t spending the time memorizing all the stuff they used to memorize, and are instead just remembering where to find it (or what search terms to google).

The results of four studies suggest that when faced with difficult questions, people are primed to think about computers and that when people expect to have future access to information, they have lower rates of recall of the information itself and enhanced recall instead for where to access it. The Internet has become a primary form of external or transactive memory, where information is stored collectively outside ourselves.

— Sparrow et al., 2011: Google Effects on Memory: Cognitive Consequences of Having Information at Our Fingertips (pdf).

Since one of the prime reasons for this blog was to help me remember all the stuff I usually forget (and where to find all the stuff I usually forget), I have to say that these results have the scent of truth. Our cyborgization continues.

So, given this shift to outsourcing our memories, it seems even more imperative that students learn how to think and solve problems, and where to look to find good information they can use in their problem solving, rather than work more on memorization of facts. There are fast becoming too many fact to memorize, and they’re almost all accessible on the internet.

Astronomic Symbols

Symbols of the major bodies in the solar system. (Image from NASA).

NASA has a nice, simple page showing the symbols astronomers use for the major bodies in the solar system and describing what they represent. The symbols are a shorthand that make it easier to take notes and draw diagrams. The Wikipedia page has a lot more detail if you need it.

Galileo Galilei's notes showing the phases of Venus, published in Il saggiatore in 1623. (Image from Galileo's Telescope).

Alas, despite their long history of use – 2500 years or more – these symbols can be the source of some very adolescent humor, so beware.

It Takes a Long Time to Go Away: Collecting Garbage on Deer Island

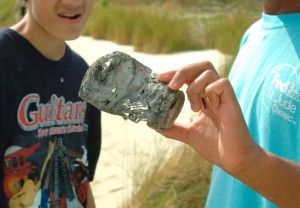
Collecting anthropogenic debris on the beach.

Plastic bottles take 100 years to break down; styrofoam cups – fifty years; aluminum cans – 200 years; glass bottles, which are made of silica, just like the beach’s white sand – who knows. So we took a little time out of our adventure trip to collect anthropogenic debris as we walked along the beach on Deer Island.

Leather (shoe) - 50 years.
Plastic bags - 10 to 20 years.
Styrofoam cup - 50 years.
Plastic bottles - 100 years.
Tin cans - 50 years. Aluminum cans - 200 years.

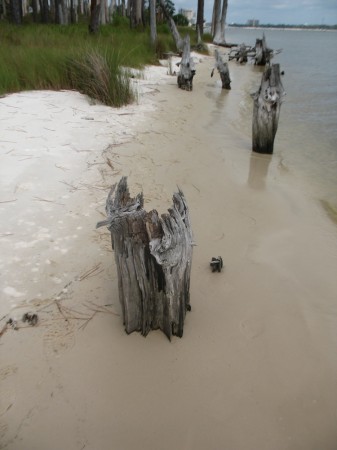
We picked up stuff on our way out, so we were able to enjoy the fruits of our labours on our walk back to the landing point.

The beautiful beach cleared of garbage.

Note

The degradation times for marine garbage can be found on the SOEST website, but That Danny has an interesting compilation of data that tries to reconcile the different degradation times you can find on the web.

Kerguelen

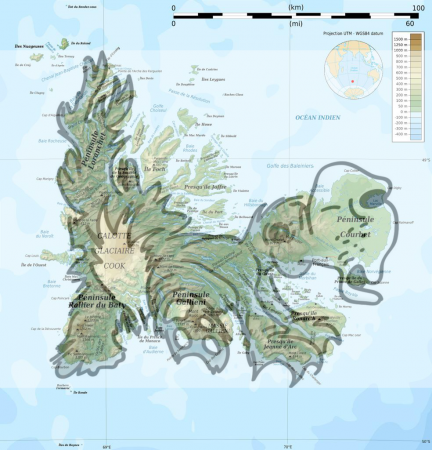
The mascot Kergolus superimposed on the islands of Kerguelen. Mascot by Mathieu Valleton and posted on Frank Jacobs' blog Strange Maps.

In response to the submission from a reader, Frank Jacobs has a wonderfully detailed post on the Southern Ocean island of Kerguelen. The island has a French scientific outpost but no permanent population.

Looking at the satellite image, with the marked contrast between the glacial snowfields and the green lowlands, the mascot fairly jumps out at you.


View Larger Map

Malthusian Growth

I think I may fairly make two postulata.

First, That food is necessary to the existence of man.

Secondly, That the passion between the sexes is necessary and will remain nearly in its present state.

— Malthus (1798): An Essay on the Principle of Population via The Concise Encyclopedia of Economics

“Malthusian” is often used as a derogatory term to refer to alarmist predictions that we’re going to run out of some natural resource. I’m afraid I’ve used the term this way myself, however, according to Lauren Landsburg at the Concise Encyclopedia of Economics, Malthus is being unfairly maligned. He wasn’t actually predicting catastrophe but wondering why the catastrophes don’t usually happen.

What Thomas Malthus did, in 1798, was point out that while populations grow at a geometric rate – the U.S. population, he noticed, doubled every 25 years – but resources, like food, only increase at an arithmetic rate. As a result, any naturally growing population will eventually run out of resources.

The red line shows geometric growth. No matter how much you start off with, the red line will always end up crossing the blue line.

The linear equation has the form:

 y = m t + b

where y is the quantity produced, t is time (the independent variable), and m and b are constants. This should not look to unfamiliar to students who’ve had algebra.

The geometric equation is a little more complicated:

 y = a^{gt} + c

here a, g and c are constants. g is the most important, because it’s the growth rate – the higher g is the faster the curve will rise. You can play around with the coefficients and graph in this Excel spreadsheet .

At any rate, after the curves intersect, the needs of the population exceeds how much it can produce; this is the point of Malthusian catastrophe.

The intersection point is where the needs of the population exceeds the production.

The observation is, indeed, so stark that it is still easy to lose sight of Malthus’s actual conclusion: that because humans have not all starved, economic choices must be at work, and it is the job of an economist to study those choices.

— Landsburg (2008): Thomas Robert Malthus from The Concise Encyclopedia of Economics.