Photosynthetic Salamanders?

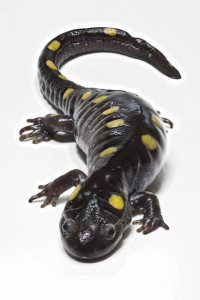
Spotted Salamander (Ambystoma maculatum). Image by Camazine via Wikipedia.

The salamanders themselves don’t do photosynthesis, but they host symbiotic algae that do.

Spotted salamanders, too, are in a long-term relationship with photosynthetic algae. In 1888, biologist Henry Orr reported that their eggs often contain single-celled green algae called Oophila amblystomatis. The salamanders lay the eggs in pools of water, and the algae colonise them within hours.

By the 1940s, biologists strongly suspected it was a symbiotic relationship, beneficial to both the salamander embryos and the algae. The embryos release waste material, which the algae feed on. In turn the algae photosynthesise and release oxygen, which the embryos take in. Embryos that have more algae are more likely to survive and develop faster than embryos with few or none.

Then in 2011 the story gained an additional twist. A close examination of the eggs revealed that some of the algae were living within the embryos themselves, and in some cases were actually inside embryonic cells. That suggested the embryos weren’t just taking oxygen from the algae: they might be taking glucose too. In other words, the algae were acting as internal power stations, generating fuel for the salamanders.

–Marshall (2013): Zoologger: The first solar-powered vertebrate in New Scientist based on Graham et al. (2012).

Terraforming Earth

Before: Barren, Volcanic. Image by Ben Tullis via Wikimedia Commons.

Charles Darwin and colleagues attempted to vegetate the barren, volcanic Ascension Island with plants from botanical gardens around the world. Essentially, it was an experiment in transforming. And it worked. Howard Falcon-Lang has the details at the BBC.

After: An eclectic, lush mix of vegetation. Image by LordHarris via Wikimedia Commons.

Assessment with the Toilet Paper Timeline of Earth History

With a larger class, and quite a bit of space in the gym, I had more flexibility working on the toilet paper timeline compared to the last time.

Labeling the timeline in the gym.

I built in a friendly race to see which group could find a set of events first, and allowed me to highlight nine different, important, series of events along the timeline.

The adapted spreadsheet, racing sequences, and a short summative quiz are on this Toilet Paper Timeline spreadsheet.

I broke the class up into 4 groups of 4, and each group created their own timeline based on a handout.

Groups of students lay out their toilet paper timelines. Post-it notes were used to label the events.

Then, I gave each group a slip of paper with four events on it (one event per student), and they had to race to see which group would be first to get one person to each event on the list. Once each group got themselves sorted out, I took a few minutes to talk about why the events were important and how they were related.

Table 1: The series of events.

1) We’ll be talking about plate tectonics soon, so it’s good for them to start thinking about the timing of the formation and breakup of the supercontinents.
Event 1 Event 2 Event 3 Event 4
Formation of Rodinia (supercontinent) Breakup of Rodina Formation of Pangea Breakup of Pangea
2) This sequence emphasizes the fact that most free oxygen in the atmosphere comes from ocean plants (plankton especially), and that a lot of free atmospheric oxygen was needed to to form the ozone layer which protected the Earth’s surface from uv radiation, which made the land much more amenable to life. Also, trees came way after first plants and oxygen in the atmosphere.
Event 1 Event 2 Event 3 Event 4
First life (stromatolites) Oxygen buildup in atmosphere First land plants First Trees
3) Pointing out that flowering plants came after trees.
Event 1 Event 2 Event 3 Event 4
First life First land plants First trees First flowering plants
4) The Cambrian explosion, where multicellular life really took off, happened pretty late in timeline. Longer after the first life and first single-celled animals.
Event 1 Event 2 Event 3 Event 4
First life (stromatolites) First animals First multicelled organisms Rise of multicelled organisms
5) Moving down the phylogenetic tree from mammals to humans shows the relationship between the tree and evolution over time.
Event 1 Event 2 Event 3 Event 4
First mammals First Primates Homo erectus Homo sapiens
6) More tectonic events we’ll be talking about later.
Event 1 Event 2 Event 3 Event 4
Opening of the Atlantic Ocean Linking of North and South America India collides with Asia Opening of the Red Sea
7) Pointing out that life on land probably needed the magnetic field to protect from the solar wind (in addition to the ozone layer).
Event 1 Event 2 Event 3 Event 4
Formation of the Earth First life Formation of the Magnetic Field First land plants
8) Fish came before insect. This one seemed to stick in students’ minds.
Event 1 Event 2 Event 3 Event 4
First Fish First Insects First Dinosaurs First Mammals
9) Mammals came before the dinosaurs went extinct. This allowed a discussion of theories of why the dinosaurs went extinct (disease, asteroid, mammals eating the eggs, volcanic eruption in Deccan) and how paleontologists might test the theories.
Event 1 Event 2 Event 3 Event 4
First Dinosaurs First Mammals Dinosaur Extinction First Primates

The whole exercise took a few hours but I think it worked out very well. The following day I gave the quiz, posted in the excel file, where they had to figure out which of two events came first, and the students did a decent job at that as well.

Semi-artificial Selection?

Just like drug resistant germs (we’ve discussed earlier), the rats are evolving.

“They’ve also mutated genetically and are bred to be immune to standard poisons.

“We have had to start using different methods such as trapping and gassing, which can be less effective and more costly.”

–Graham Chappell, from Rapid Pest Control in Newbury in Rowley (2012): Home counties demand stronger poison to deal with mutant ‘super rats’ in The Telegraph.

Building a Tree of Life (version 2)

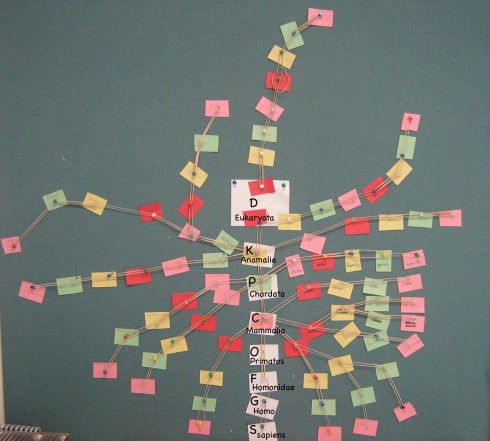
Phylogenetic tree of randomly selected organisms.

I so liked how the tree of life turned out the last time I tried it, that I did it again this year with a significant improvement in the use of rubber bands.

Students chose organisms and then looked up their classification — Wikipedia quite reliable for this — then they wrote the names down on synchronized chips of colored paper. As usual, they preferentially chose charismatic, mammalian, megafauna, but there was also a squid, and for two people who did not come up with anything themselves, I assigned a plant (elm), and a bacteria (the one that causes strep throat).

The actual color pattern of the chips does not matter, but I used red for Domain, yellow for Kingdom, green for Phylum, pink for Class, red for Order, yellow for Family, green for Genus, and pink for species. The colors repeated, and I liked how that helped organize the pattern of the final result.

In class, using a pin-board, I used push pins to place homo sapiens on the board. I linked the push pins with rubber bands, which makes for a nicer, sharper pattern than using string, and is easier to do.

To get a nice pattern I then asked who had the closest relative to humans. It took a little effort to figure it out, but I decided to go with a degrees-of-separation metric. Basically, I asked them to count up the classification system to see how many levels they’d have to go to get to something their species shared with humans. The closest were at the Class level: mammals.

Then, starting with the students with the lowest separation distance, I had the students come up to the board and add their organism to the growing tree.

Later, during lunch, a student asked me what was the difference between bison and buffalo. I didn’t know, but another teacher pointed out that one was from North America and the other from Africa. So I asked two of my middle schoolers to look up the classification of american bison and water-buffalos, which we subsequently added to the tree, and which got me thinking about how we might use the rate of separation of the two continents to figure out how fast genetic variation develops.

Buffalo vs. Bisons: Using their Phylogenetic Classification to Estimate the Rate of Evolution

Classification of american bison and water buffalos.

American bison (Bison bison) are native to North America, while water buffalo (Bubalus bubalis) are from Africa. They are different species, and each are classified in a different genus, however, they belong to the same Family, Bovidae. Since it’s highly unlikely that there was any genetic intermingling after Africa separated from North America, if we can figure out how long ago the two continents were together, we can estimate how long ago their common ancestor lived, and how fast evolution occurs (at least in large mammals).

Continental Rifting

North America is moving away from Africa at an average spreading rate of about 2.5 cm/year, and the continents are about 4550 km apart.

To figure out how long it has been since the continents were together, we need to convert the distance into the same units as the spreading rate and then divide by the rate.

Converting the distance to cm:
 \frac{4550 \text{km}}{1} \times \frac{1000\text{m}}{1\text{km}} \times  \frac{100\text{cm}}{1\text{m}}   = 455,000,000 \text{cm}

Finding the time:
 \frac{455,000,000 \text{cm}}{2.5 \text{cm/year}}= 182,000,000 \;\text{years}

So we get 182 million years.

Evolutionary Rates

Now to get really back-of-the-envelope. If it takes 182 million years to be separated by two levels of classification (the genus and species levels), then it takes approximately 91 million years for each level of classification.

If we extend this backwards up the phylogenetic tree (species –> Genus –> Family –> Order –> Class –> Phylum –> Kingdom ), which is probably illegal, we get a grand total of six levels of classification back to the divergence of the plant and animal kingdoms. That’s 546 million years, which is remarkably close to the time of the first fossil records of complex multi-cellular life, somewhere near the beginning of the Cambrian about 540 million years ago.

The major caveat, however, is that the first phylogenetic step, from Domain to Kingdom took a lot longer than our 91 million year average, since the first life appeared on Earth about 4 billion years ago.

Conclusion

There are lots of issues with this analysis, but the result is curiously coincidental. I’d really appreciate any thoughts on the validity of this particular exercise.

Note:

The spreading happens at the Mid-Atlantic Ridge, which bifurcates the Atlantic. However, if you look at a map of the bathymetry of the North Atlantic, you can see long striations — lines — that show the direction of the tectonic plate motion. The distance the continents moved are best measured along this line.

Invasive Species on Campus

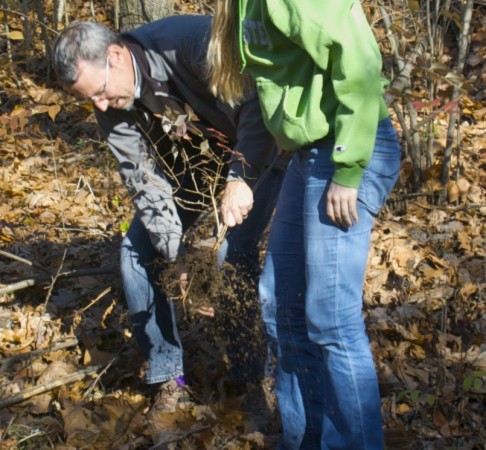
A student helps Scott Woodbury uproot an invasive bush honeysuckle.

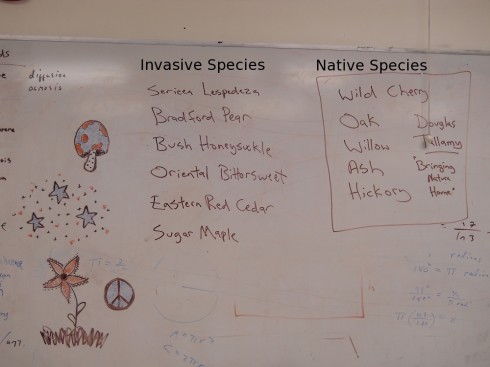
Last Friday, we were lucky enough to have a horticulturalist, Scott Woodbury, visit the Environmental Science class. Scott teaches the Native Plant School at the Shaw Nature Reserve, and spends a lot of effort dealing with invasive species.

The extent of the problem on our campus was quite sobering. The invasive trees, shrubs, and vines displace native plants, and animals as well because the native fauna are not adapted to them. A native elm might support somewhere around 300 species of caterpillar, while an imported bradford pear might have just a few; Douglas Tallamy has a good book, Bringing Nature Home, on the subject.

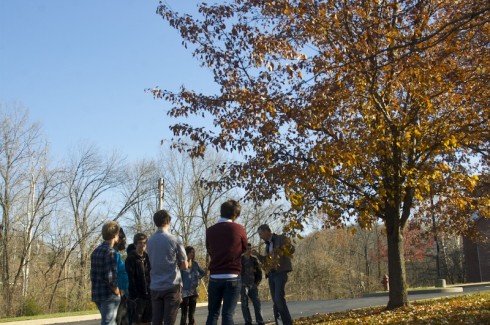
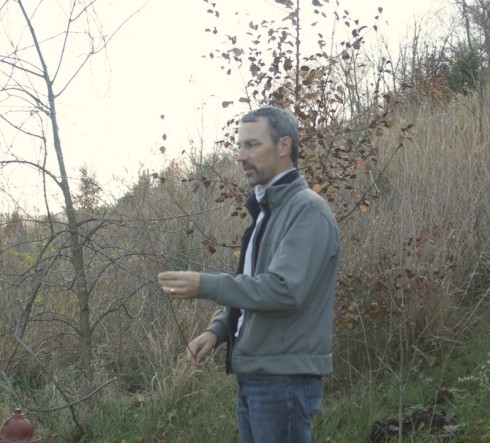
This beautiful bradford pear is one of half a dozen at the front of the building. They are quite aggressive however, and their progeny can be found all the way along the creek and up the slope.
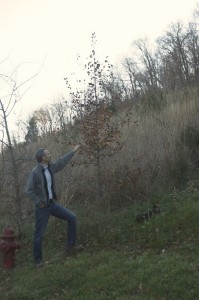
A young bradford pear on the slope.

The bradford pears are quite pernicious. They were once favored by landscapers because of their beautiful spring flowers and brilliant fall colors. However, the birds spread their seeds far and wide, and now bradford pear saplings can be found all over the campus. They tend to do better in the grassy areas at the sides of the roads, as well as on the slope overlooking the school that’s still in the early stages of succession. The saplings can be cut down with hand saws, and I doubt anyone would notice that they were gone, but it’s probably going to be tricky getting permission to take down the half dozen mature trees on the front lawn that were planted when the school was built.

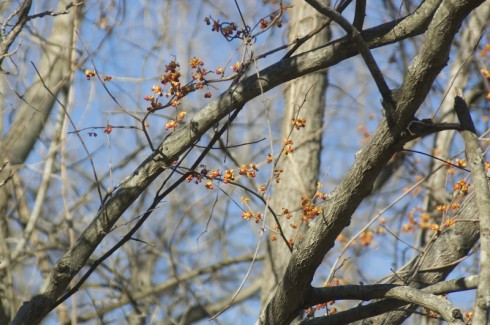
Bright orange berries on a vine of oriental bittersweet.

The dark secret about the oriental bittersweet vine that’s attacking the trees along the creek, is that they probably came from the Shaw Nature Reserve. Apparently there was a mistake at one of their sales, and one of our teachers bought the wrong species of bittersweet. Cutting the vines that are growing up the tree trunks should slow them down.

Scott Woodbury holds the long stem of a specimen of sericea lespedeza. The entire slope behind him is covered with the species.

Sericea lespedeza has pretty much taken over the slope above the school. This herb was imported for erosion control but was found to be extremely hard to control. On the plus side, while it does well in disturbed areas like the slope, since it is an early succession species, it will be succeeded by the tree species that are now growing up through it. It’s just going to take a number of years.

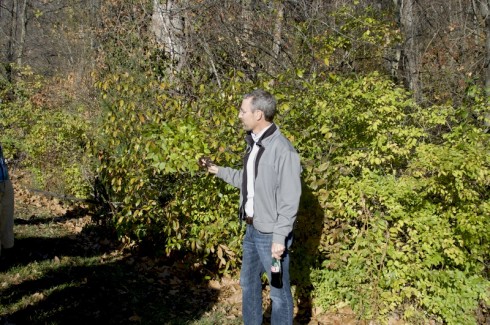
Bush honeysuckle.
Hand pulling a bush honeysuckle.

At least the bush honeysuckles, which can be found all along the creek, can be hand pulled if they’re small enough. However, we’ve got some pretty big specimens that are much harder to get rid of. They grow fast, leaf-out early, and crowd out the native shrubs.

Interestingly, all these four species are all from Asia. The latitude is similar to Missouri’s so species from that part of the world can thrive here where the climate is similar and they don’t have their native predators and pests. Scott did point out a couple of native species — eastern red cedars and sugar maples — that have become much more aggressive because of all the fire suppression over the last few hundred years, but that’s a story for another time.

Invasive versus native species.