The Geology of Oil Traps Activity

The following are my notes for the exercise that resulted in the Oil Traps and Deltas in the Sandbox post.

Trapping Oil

Crude oil is extracted from layers of sand that can be deep beneath the land surface, but it was not created there. Oil comes from organic material, dead plants and animals, that sink to the bottom of the ocean or large lakes. Since organic material is not very dense, it only reaches the bottom of ocean in calm places where there are not a lot of currents or waves that can mix it back into the water. In these calm places, other very small particles like clay can also settle down.
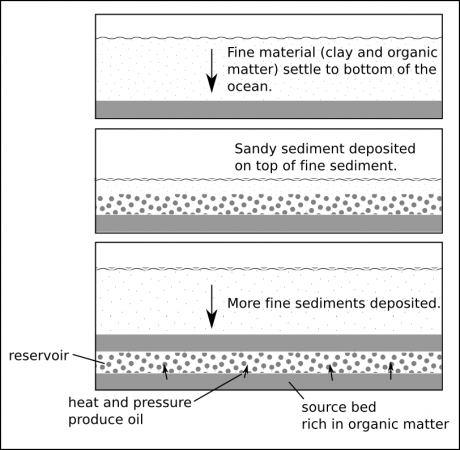
Figure 1. Formation of sandstone (reservoir) and shale (source bed).

Over time, millions of years, this material gets buried beneath other sediments, compressing it and heating it up. Together the organic material and the clay form a type of sedimentary rock called shale. As the shale gets buried deeper and deeper and it gets hotter and hotter, and the organic matter gets cooked which causes it to release the chemical we know as natural gas (methane) and the mixture of organic chemicals we call crude oil (see the formation of oil and natural gas).
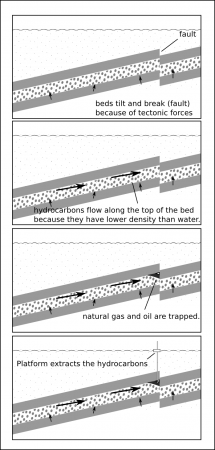
Figure 2. The trapping of oil and natural gas by a fault.

Shale beds tend to be pretty tightly packed, and they slowly release the oil and natural gas into the layers of sediment around them. If these layers are made of sandstone, where there is much more space for fluids to move between the grains of sand, the hydrocarbons will flow along the beds until they are trapped (Figure 2).

In this exercise, we will use the wave tank to simulate the formation of the geologic layers that produce oil.

Materials

  • Wave tank
  • Play sand (10x 20kg bags)
  • Colored sand (2 bags)

Observations

For your observations, you will sketch what happens to the delta in the tank every time something significant changes.

Procedure

  1. Fill the upper half of the tank with sand leaving the lower half empty.
  2. Fill the empty part with water until it starts to overflow at the lower outlet.
  3. Move the hose to the higher end so that it creates a stream and washes sand down to the bottom end — observe the formation of the delta.
  4. Observe how the delta builds out (progrades) into the water.
  5. After about 10 minutes dump the colored sand into the stream and let it be transported onto the delta.
  6. After most of the colored sand has been transported, raise the outlet so that the water level in the tank rises to the higher level. — Note how the delta forms at a new place.
  7. After about 10 more minutes dump another set of colored sand and allow it to be deposited on the delta.
  8. Now lower the outlet to the original, low level and observe what happens.
  9. After about 10 minutes, turn off the hose and drain all of the water from the tank.
  10. When the tank is dry, use the shovel to excavate a trench down the middle of the sand tank to expose the cross-section of the delta.

Analysis

1. How did changing the water level affect the formation of the delta.

-
-
-
-
-
-

2. When you excavated the trench, did you observe the layers of different colored sand in the delta? Draw a diagram showing what you observed. Describe what you observed here.

-
-
-
-
-
-

3. Was this a realistic simulation of the way oil reservoirs are formed. Please describe all of the things you think are accurate, and all of the things you think are not realistic?

-
-
-
-
-
-
The Formation of Oil and Natural Gas

When organic material is buried it is compressed and “cooked” because the deeper you go beneath the surface of the earth the hotter it gets. This causes the breakdown of the organic matter and the production natural gas and oil. The stages of decomposition are:

Diagenesis:

  • Decomposition of biological material produces methane gas. At slightly higher temperatures and pressures the organic matter is converted to kerogen – an unorganized (amorphous) material of carbon, hydrogen, and oxygen.

Catagenesis:

  • At higher temperatures and pressures kerogen is altered and the majority of crude oil is formed. During this phase and the next, the larger molecules break down into simpler molecules such as octane and propane (a process called cracking).

Metagenesis:

  • In the final stage of alteration (at higher temperatures and pressures) of kerogen and crude oil, natural gas (mostly methane) is produced and residual carbon is left in the source rock.

Where the Trees Are

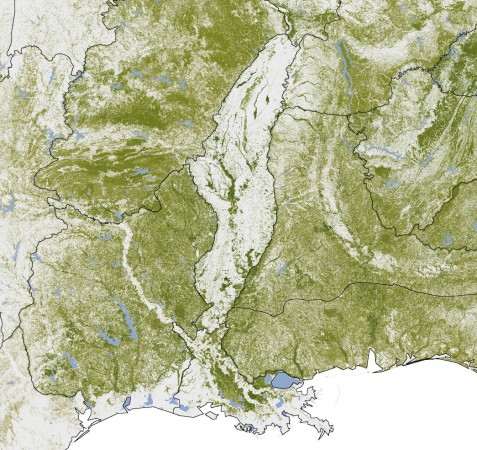
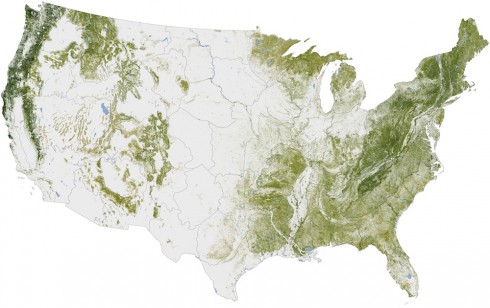
Map of Woody Biomass in the U.S. in the year 2000, by the Woods Hole Research Center, via NASA's Earth Observatory.

The Woods Hole Research Center put together this map of “Aboveground Woody Biomass” that essentially shows where the trees are in the U.S.. The map was created using, primarily, satellite imagery. Their website has a nice, interactive, version of the map, and a 3d video flyover of the of southeastern Georgia.

Trees build their woody biomass using carbon from the atmosphere (remember during photosynthesis plants absorb carbon dioxide gas), so these trees are represent stored carbon. If they are burned their carbon is released to the atmosphere. If more trees are planted then they will absorb more carbon dioxide from the atmosphere. This map serves as an inventory of what we have now; a baseline for discussions about what to do about carbon-driven climate change.

The Mississippi River flood plain shows up remarkably well because of it's lack of trees. Flood plains are great for agriculture.

Chasing Raindrops: A Hike in Natchez Trace State Park

In which we follow the path of a raindrop from the watershed’s divide to its estuary on the lake.

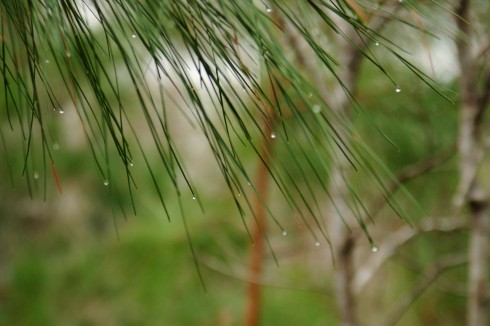
Droplets of water scintilate at the tips of pine needles. When they fall to the ground they continue their never-ending journey in the water cycle.

The most recent immersion. Coon Creek.

We stayed at Natchez Trace State Park and just a couple meters away from the villas is the head of the Oak Ridge Trail (detailed park map here).


View Natchez Trace Immersion Hike in a larger map

The first thing you notice is a small, rickety bridge whose main job is to keep your feet dry as you cross a very small stream. The stream is on its delta, so the ground is very soggy, and the channel is just about start its many bifurcations into distributaries that fan out and create the characteristic deltaic shape.

Delta and estuary of the small stream near the villas.

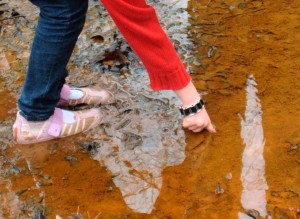
There’s a bright orange flocculate on the quieter parts of the stream bed. It’s the color of fresh rust, which leads me to suspect it’s some sort of iron precipitate.

It is quite easy to stick your finger into the red precipitate at the bottom of the stream.

Iron minerals in the sediments and bedrock of the watershed are dissolved by groundwater, but when that water discharges into the stream it becomes oxygenated as air mixes in. The dissolved iron reacts with the oxygen to create the fine orange precipitate. Sometimes, the chemical reaction is abiotic, other times it’s aided by bacteria (Kadlec and Wallace, 2009).

The bark has been chewed off the top half of this stick. The tooth marks are characteristic of beavers.

Past the small delta, the trail follows the lake as it curves around into another, much bigger estuary (see map above). We found much evidence of flora and fauna, including signs of beavers.

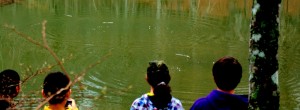
We even took the time to toss some sticks into the water to watch the waves. With a single stick, you can see the wave dissipate as it expands, much like I tried to model for the height of a tsunami. We also threw in multiple sticks to create interference patterns.

Observing interference patterns in waves.

The Oak Ridge Trail, which we followed, diverges from the somewhat longer Pin Oak Trail at the large estuary (which is marked on the map). The Pin Oak Trail takes you through some beautiful stands of conifers, offering the chance to talk about different ecological communities, but we did not have the time to see both trails.

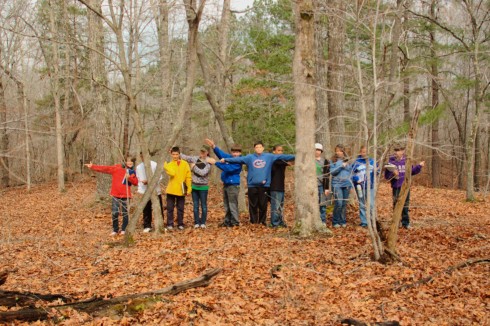
Instead, we followed the Oak Ridge Trail up the ridge (through one small stand of pines) until it met the road. The road is on the other side of the watershed divide. I emphasized the concept by having my students stand in a line across the divide and point in the direction of that a drop of water, rolling across the ground, would flow.

At the watershed divide.

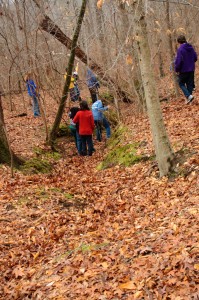
Then I told them that we’d get back by following our fictitious water droplet off the ridge into the valley. And we did, traipsing through the leaf-carpeted woods.

Students imitating water droplets find a dry gully.

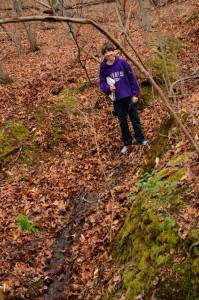
Of course there were no water droplets flowing across the surface. Unless its actively raining, water tends to sink down into the soil and flow through the ground until it gets to the bottom of the valley, where it emerges as springs. Even before you see the first spring, though, you can see the gullies carved by overland flow during storms.

Spring.

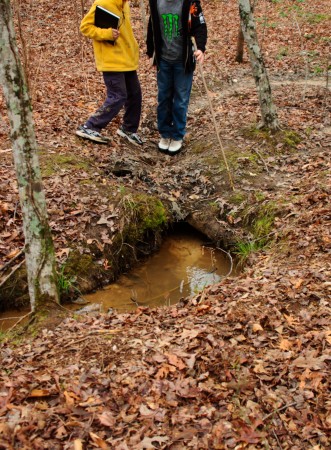
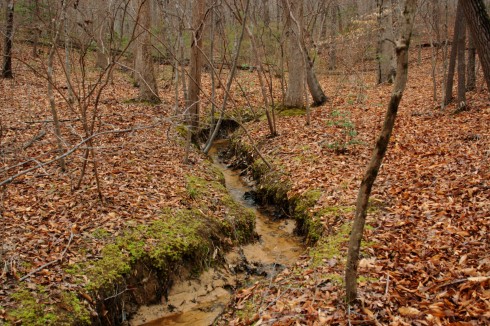
Following the small stream was quite enjoyable. It was small enough to jump across, and there were some places where the stream had bored short sections of tunnels beneath its bed.

The stream pipes beneath its bed. Jumping up and down over the pipe caused sediment to be expelled at the mouth of the tunnel.

I took the time to observe the beautiful moss that maintained the banks of the stream. Students took the time to observe the environment.

Taking a break at the confluence of two streams.

Downstream the valley got wider and wider, and the stream cut deeper and deeper into the valley floor, but even the small stream sought to meander back and forth, creating beautiful little point bars and cut-banks.

A small, meandering channel. Note the sandy point bars on the inside of the bend, and the overhanging cut-banks on the outside of the curve.

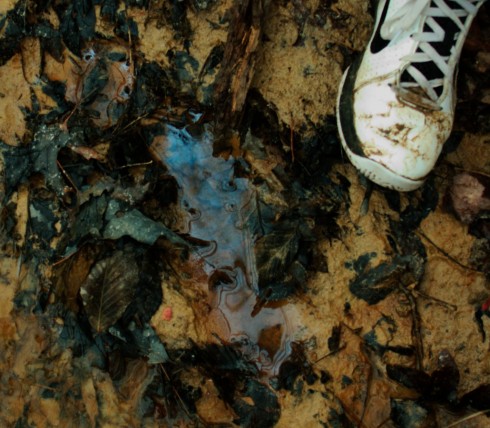
As the stream approached its estuary it would stagnate in places. There, buried leaves and organic matter would decay under the sediment and water in anoxic conditions, rendering their oils and producing natural gas. We’re going to be talking about global warming and the carbon cycle next week so I was quite enthused when students pointed out the sheen of oils glistening on isolated pools of stagnant water.

The breakdown of buried organic matter produces gas and oils that are less dense than water.

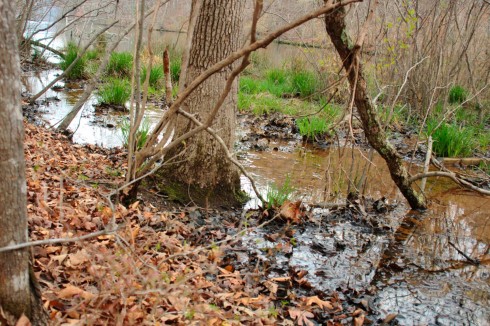
Finally, we returned to the estuary. It’s much larger than the first one we saw, and it’s flat, swampy with lots of distributaries, and chock full of the sediment and debris of the watershed above it.

View of the lake from the estuary. The red iron floc in the stream made for a beautiful contrast with the black of the decaying leaves. There is so much red precipitate that it is visible on the satellite image.

This less than three kilometer hike took the best part of two hours. But that’s pretty fast if you value your dawdling.

Oil traps and deltas in the sandbox

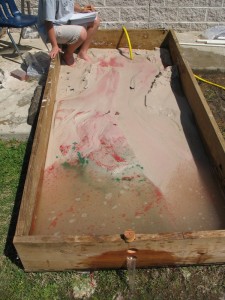
Red and green sand added for marker beds.

The sandbox was built to be a wave tank so we could look at interference patterns and wave properties. But if you tilt it a little, and put in a few holes on the lower end, you can get sandbox to look at the formation of streams, deltas and the sedimentary layering that traps oil and natural gas.

Using the holes at the bottom end the students started with a low “sea-level”, raised it and lowered it. At the end of the run, they drained all the water and sliced the tank to see the depositional layers in cross-section.

We added red and green sand to try to make marker beds before each change in base level. The marker beds worked reasonably well, but it would have been better to have sand with different densities that could be sorted by the stream flow and depositional environment. It also helps to get the colored sand wet, to make a slurry, otherwise the grains will float on the water.

The shifting lobes of the delta showed up very well (see the animation) and some nice river features showed up as well. What I want to do sometime is to have students build coastlines and have waves erode them away creating typical coastal features.

My students were even able to demonstrate the tank for their presentation, because it really only takes half an hour to get all the features if you know what you’re aiming for.

Sources

The exercise these results are based on is posted as The Geology of Oil Traps Activity.

Steam distillation

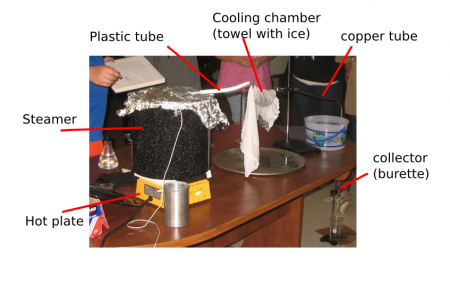
Steam distillation apparatus.

We’re talking about the carbon cycle and the production of fossil fuels, so I though it would be interesting to try extracting oils from plants, to demonstrate that it can be done. So one of my small groups put together a steam distillation apparatus using stuff that we had at hand and a length of copper tubing that we picked up at the hardware store.

We tried extracting the essential oils from lemon balm, because it grows like a weed here and even this early in the spring I have too much of it in the back yard (the middle school does not yet have an herb garden).

The distiller apparatus worked fairly well itself. Our improvised cooling chamber was a towel with ice in it draped over the copper tube. The melted ice-water would wick up the towel and evaporate as the water cooled the copper tube. You could see the steam rising off the the towel, an excellent example of phase changes in water resulting from transfers of energy.

We did not get any nice oil separation in the distillate, probably because we did not use enough lemon balm, but we got wonderfully fragrant water (in the flask on the left side of the picture). The water left behind in the pot also turned an ugly brown and looked a bit like crude oil (or tea) at least in a test tube.

Planes versus the volcano

CO2 emissions by Planes or Volcano, by David McCandless

David McCandless’ graphic showing the amount of CO2 emitted by the European airline industry compared to the amount emitted by the volcano that shut down that industry for several days is beautiful in its simplicity. It seems that despite the fact that volcanoes emit a lot of CO2, the volcanic eruption reduced total emissions of carbon dioxide into the atmosphere.